Cross-Indicator Playbooks
Workflows
Twelve cross-indicator workflows that combine 2+ FlowEntry indicators to answer questions no single indicator can answer alone.
How to read this page
Each workflow has a question it answers, an ordered set of steps, a confluence trigger (what high-conviction looks like), and a counter-signal (what tells you to skip). The combinations are not random; they layer count + direction + size, per-coin + market-wide, and historical + live to produce reads no single indicator can produce.
Daily routine
W1: The Morning Check
What is the state of the market right now, and where should I look first?
Steps
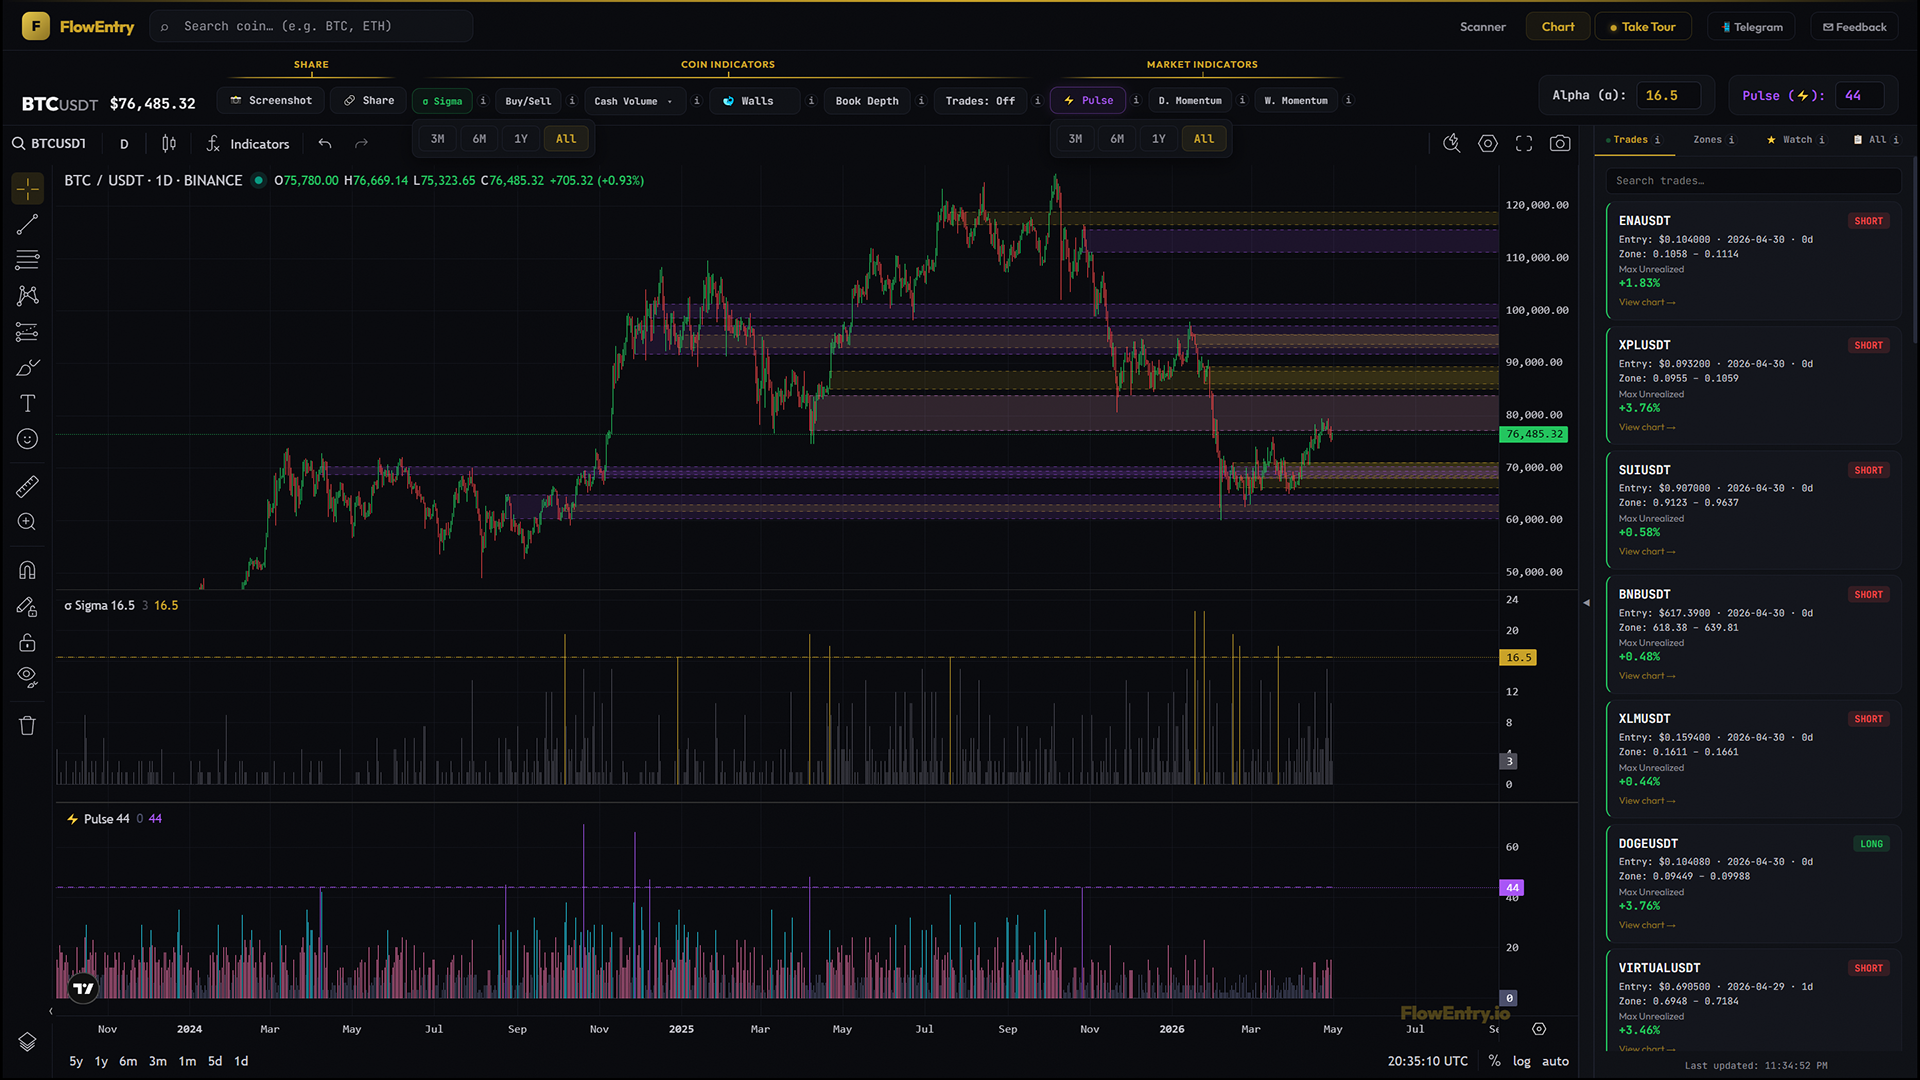
- Open the BTC chart. Toggle Pulse, D. Momentum, W. Momentum. Three market-wide reads in three histogram panes.
- Read the regime: all green / light blue / purple Pulse run is a strong bull regime; mixed gold / mid blue / cyan-pink Pulse is transitional; all red / dark blue / slate Pulse is a quiet bear regime.
- Switch to the Scanner (Live). Count ✦ tiles. The “N coins above α” stat is your at-a-glance read of how loud today is.
- Look for ✦ + book-direction badges agreeing. ✦ + B:NN% is unusual flow plus bid-stacked book. The cleanest single-tile setups.
- Switch to the Scanner 7D. Read the consistent firers (high 🔥×N). Same coins on top of both Live and 7D = trend continuation. Different coins = rotation in progress.
- Open the sidebar Trades tab. Read the bot’s open book. Count of trades, max-unrealized magnitudes.
- Open the Zones tab. Read the queue, what is being watched for tomorrow’s daily close.
Confluence trigger
Pulse purple + D. Momentum green + W. Momentum light blue + Scanner Live full of ✦ + Trades tab full of high-max-unrealized cards = strong day, lean in.
Counter-signal
Pulse slate + Scanner Live empty + Trades tab thin or all-fresh = quiet, sit on hands until something fires.
Daily routine
W2: End-of-Day Review
What did the bot do today, and was today’s setup tradable?
Steps
- Open the Trades tab. Read which new positions opened today (0d cards with no max yet).
- Open the Zones tab. Note which zones graduated to ACTIVE (left the queue) and which new zones appeared.
- For each new entry, click into the chart. Toggle Trade Markers to see the entry arrow plus candle recolour starting today.
- Toggle Sigma, Buy/Sell, Cash Volume Net mode. Read the count, direction, and size of today’s flow on that coin.
- Toggle Pulse and D. Momentum. Read the market context of today’s entry.
- Triangulate: was the entry in a hot regime (high-confidence) or against the regime (contrarian)?
Confluence trigger
New entry + ✦ Sigma + matching Buy/Sell direction + Cash Volume Net agrees + Pulse purple + D. Momentum aligned = textbook entry, watch it run.
Counter-signal
New entry + Sigma fired but Buy/Sell mismatched + Cash Volume Net flat + Pulse slate = the bot fired the rule but the surrounding signal is thin. Mark as “watch for stop-out”.
Discovery
W3: Scanner-First Triage
I have 5 minutes and no coin picked. What is worth opening?
Steps
- Open Scanner Live. Sort visually, top row = most active.
- Filter for ✦ + book-direction agreement. ✦ + B:NN% for long bias, ✦ + A:NN% for short bias.
- Pick by σ magnitude. Among the dual-signal tiles, the brighter background means louder σ.
- Click the top 1 to 3 tiles. On each chart, toggle Sigma, Buy/Sell, Cash Volume. Confirm count + direction + size all agree.
- Form a view per coin. All three agree on direction = high-conviction setup. Two agree, one diverges = setup with caveats. Disagree = skip.
Confluence trigger
✦ + book agreeing + Sigma history clean + Buy/Sell matching + Cash Volume Net matching = quadruple agreement. Rare and high-conviction.
Counter-signal
✦ + book opposing (e.g. ✦ with A:NN%) is a “look closer” tile, not a clean trade. See W7.
Discovery
W4: Accumulation Hunt
Are any coins being quietly accumulated without the broader market noticing?
Steps
- Confirm a quiet regime first. Pulse cold or pink, D. Momentum red or gold, W. Momentum dark or mid blue. If the market is loud, accumulation gets drowned in noise.
- Scanner Live in this regime, most tiles cold. Look for the contrarian ✦ tiles (the few that fired despite the quiet market).
- For each contrarian ✦, open the chart and look at: Sigma (gold days clustering recently?), Buy/Sell (green-dominant on those days?), Cash Volume Net (net positive on the gold days?), Book Depth (gold band 1 + gold band 3, the barbell book?), Whale Walls (cyan walls holding under price across refresh cycles?).
- Scanner 7D for the same coin: high 🔥×N across the past week confirms recurrence, not a single pop.
Confluence trigger
✦ in a cold regime + clustered gold Sigma days + green Buy/Sell + green Net Cash Volume + barbell Book Depth + holding cyan walls + 🔥×3+ in 7D = the highest-quality accumulation setup the app produces. Rare.
Counter-signal
Single isolated ✦ with no recent Sigma history + book symmetric (no badge) + flat Cash Volume Net = pop, not accumulation.
Setup validation
W5: Trade Validation
I have a coin and a chart pattern I like. Is the flow agreeing?
Steps
- Sigma: did flow fire on the breakout/setup day? Gold = yes; gray = no. No gold, abort.
- Buy/Sell: which side fired? Match against the breakout direction. Bullish + green = matched. Bullish + red = suspicious.
- Cash Volume Net: in dollars, who won the day? Net green and large = real money on the bull side. Net flat or net opposite = count-loud, dollar-thin.
- Pulse: was today a market day or a coin day? Pulse purple + your coin’s ✦ = market-wide rotation. Pulse cold + your coin’s ✦ = isolated mover.
Confluence trigger
All four indicators agree on direction + size + market context = highest-conviction validation. The four answer count + direction + size + regime.
Counter-signal
Sigma gray, OR Sigma gold but Buy/Sell mismatched, OR Cash Volume Net flat, OR Pulse cold during a “rotation” thesis = re-evaluate.
Setup validation
W6: Zone Quality Check
This Sigma gold zone looks interesting. Is it defended or fragile?
Steps
- Sigma gold zone exists. That is the precondition.
- Read the alert day’s Buy/Sell. Establishes the zone’s origin direction.
- Read the alert day’s Cash Volume Buy/Sell mode. Was the dollar weight on the same side as the count? Agreeing = the zone has real money in it.
- Book Depth over the days the zone has been visible. Has the book been bid-stacked under the zone (gold) or ask-stacked above (silver)?
- Whale Walls live. Cyan wall inside a gold zone with bid-leaning book = Triple Confluence. Pink wall inside with ask-leaning book = Trap Warning.
Confluence trigger
Zone origin direction + book historically agreeing + Triple Confluence wall = highest-quality defended zone.
Counter-signal
Trap Warning tooltip on a wall inside the zone. Treat the zone as a magnet for a stop hunt, not a defence.
Setup validation
W7: Trap Detection
This breakout is happening. Is it real, or is it a trap I am being lured into?
Steps
- Sigma on the breakout day: was there flow at all? No ✦ = no signal, the breakout has no fuel.
- Buy/Sell on the breakout day: does the dominant side match the breakout direction? Mismatch is the headline trap signal.
- Cash Volume Buy/Sell mode on the breakout day: count vs dollars. Count says sellers, dollars say balanced = hidden absorption (not a trap). Count says buyers, dollars say balanced = hidden distribution (the trap).
- Whale Walls live: a wall on the opposite side of the breakout direction sitting just past price. Wall pulling (ghost) right as price reaches it = whale stepping out of the way.
- Whale Walls tooltip on any wall inside a Sigma zone: Trap Warning text? That is the explicit trap signal.
- Scanner tile: ✦ with opposing book badge = the live book is positioned against the breakout.
Confluence trigger
Sigma fired + Buy/Sell mismatched + Cash Volume Net agreeing with the opposite side of the breakout + Trap Warning tooltip + opposing book on Scanner = high-confidence trap, fade or stand aside.
Counter-signal
All four indicators agree with the breakout direction + walls supporting from behind = real breakout, not a trap.
Market regime
W8: Regime-Change Detection
Is the market actually flipping regimes, or is this just a pullback / counter-trend rally?
Steps
- W. Momentum colour transition. Slowest, most reliable, but late. Dark → mid → light blue = bigger bull starting. Light → mid → dark = bigger bear starting (especially after persistent light blue).
- D. Momentum colour transition in the same window. Faster, confirms the W. flip is real. Red → gold → green = bull lifecycle. Green → gold → red = bear lifecycle.
- Pulse purple cluster around the same dates. Flow confirmation.
- Trade Markers across coins. Are bot trades flipping direction? Stop-and-reverses across multiple coins in a short window = the strategy itself is registering the change.
- Scanner 30D. Who is leading the change? Coins with 🔥×8+ over the past month are the rotation candidates for the new regime.
Confluence trigger
W. Momentum flip + D. Momentum flip + Pulse purple cluster all in the same 1 to 2 week window = triple-indicator regime change. The rarest, highest-conviction signal in the app.
Counter-signal
D. flipped but W. didn’t = counter-trend rally inside an unchanged bigger trend. Trade with caution.
Market regime
W9: Overheating Watch
Is this bull regime getting too hot? Should I de-risk?
Steps
- W. Momentum light blue persistent. Many consecutive weeks. Persistent light blue is itself the warning.
- D. Momentum green persistent. Same regime in the daily view.
- Pulse recurring purple. The market keeps lighting up, day after day.
- Scanner Live: most tiles ✦, most with bid-leaning books. The market is unanimous.
- First slip from W. light blue to mid blue. The headline warning. Before W. flips fully to dark, the first mid-blue week is the early signal.
- Sigma gold days at the top of charts. Often signals smart money taking profit.
- Cash Volume Net flipping red while price drifts up. The dollars are leaving even as the chart still climbs.
Confluence trigger
Persistent W. light blue + Sigma golds at chart highs + Cash Volume Net flipping red + Pulse purple at the top = distribution underway, the run is ending.
Counter-signal
First W. mid-blue is a false slip. Next week comes back light blue + breadth still strong + Cash Volume Net stays green. Stay long.
Strategy + postmortem
W10: Bot-Mirror
Should I follow this trade the bot is in?
Steps
- Trades tab: pick a card with a high Max Unrealized magnitude.
- Click into the chart. Toggle Trade Markers to see the entry arrow plus candle recolour.
- Read the entry day’s stack (apply W5: Sigma + Buy/Sell + Cash Volume + Pulse).
- Read the regime the entry was made in. Pulse on entry day, plus D. and W. Momentum.
- Read the Zones tab for the same coin. Is there a fresh zone queued up that could replace this trade soon?
- Whale Walls right now: walls supporting the open trade direction?
- Book Depth: has the book been agreeing with the trade direction across days?
Confluence trigger
High max-unrealized + clean entry-day stack + regime-aligned + walls supporting + book agreeing = the bot found a high-quality setup; mirroring is defensible.
Counter-signal
High max-unrealized but entry-day stack was thin + walls now opposing + book has rotated against the trade = the bot is getting lucky on a setup that is rotting underneath.
Strategy + postmortem
W11: Event Postmortem
Something happened in the market last week (BTC pumped, news event, regime flip). Which coins led, which lagged, what does it tell me?
Steps
- Pick the event’s date range. Open Scanner Custom and input from and to.
- Read the leaders. Highest 🔥×N tiles = coins that fired most during the event window. Sparkline shape tells you the pattern.
- Check Pulse history during the same window. Confirms whether the event was market-wide or asset-specific.
- Check D. Momentum and W. Momentum shape during the window. Did the colour shift through the event?
- Click into 2 to 3 high-🔥×N leaders. On each chart: Sigma, Buy/Sell, Trade Markers (Trades: All), Cash Volume Net.
Confluence trigger
A short list of “coins that led during X event” with an indicator-backed explanation of why they led. A watchlist for the next similar event.
Counter-signal
No coins with high 🔥×N during the window = the event was thin or asset-specific.
Strategy + postmortem
W12: Why Did That Trade Work (or fail)?
A specific trade closed. Why did it win, or why did it lose?
Steps
- Trade Markers in “Trades: All” mode on the coin’s chart. Find the closed trade.
- Read the entry day’s stack (W5 chain).
- Read the exit day’s stack the same way. What changed between entry and exit?
- Inspect the candle recolour period. Did indicators stay supportive, or flip mid-trade?
- Read the regime context across the trade duration (D. Momentum, W. Momentum).
- Compare max-unrealized vs realised P&L. If max was big and realised was small, the bot’s exit logic gave back the move. Different lesson than “the setup failed”.
Confluence trigger
A clear answer to “did the setup work and the exit fail” vs “the setup never had real flow behind it” vs “the regime changed mid-trade”.
Counter-signal
No clear answer = data is too thin or the trade was inside a chop window. Mark as inconclusive.