Market-Wide Indicator
W. Momentum
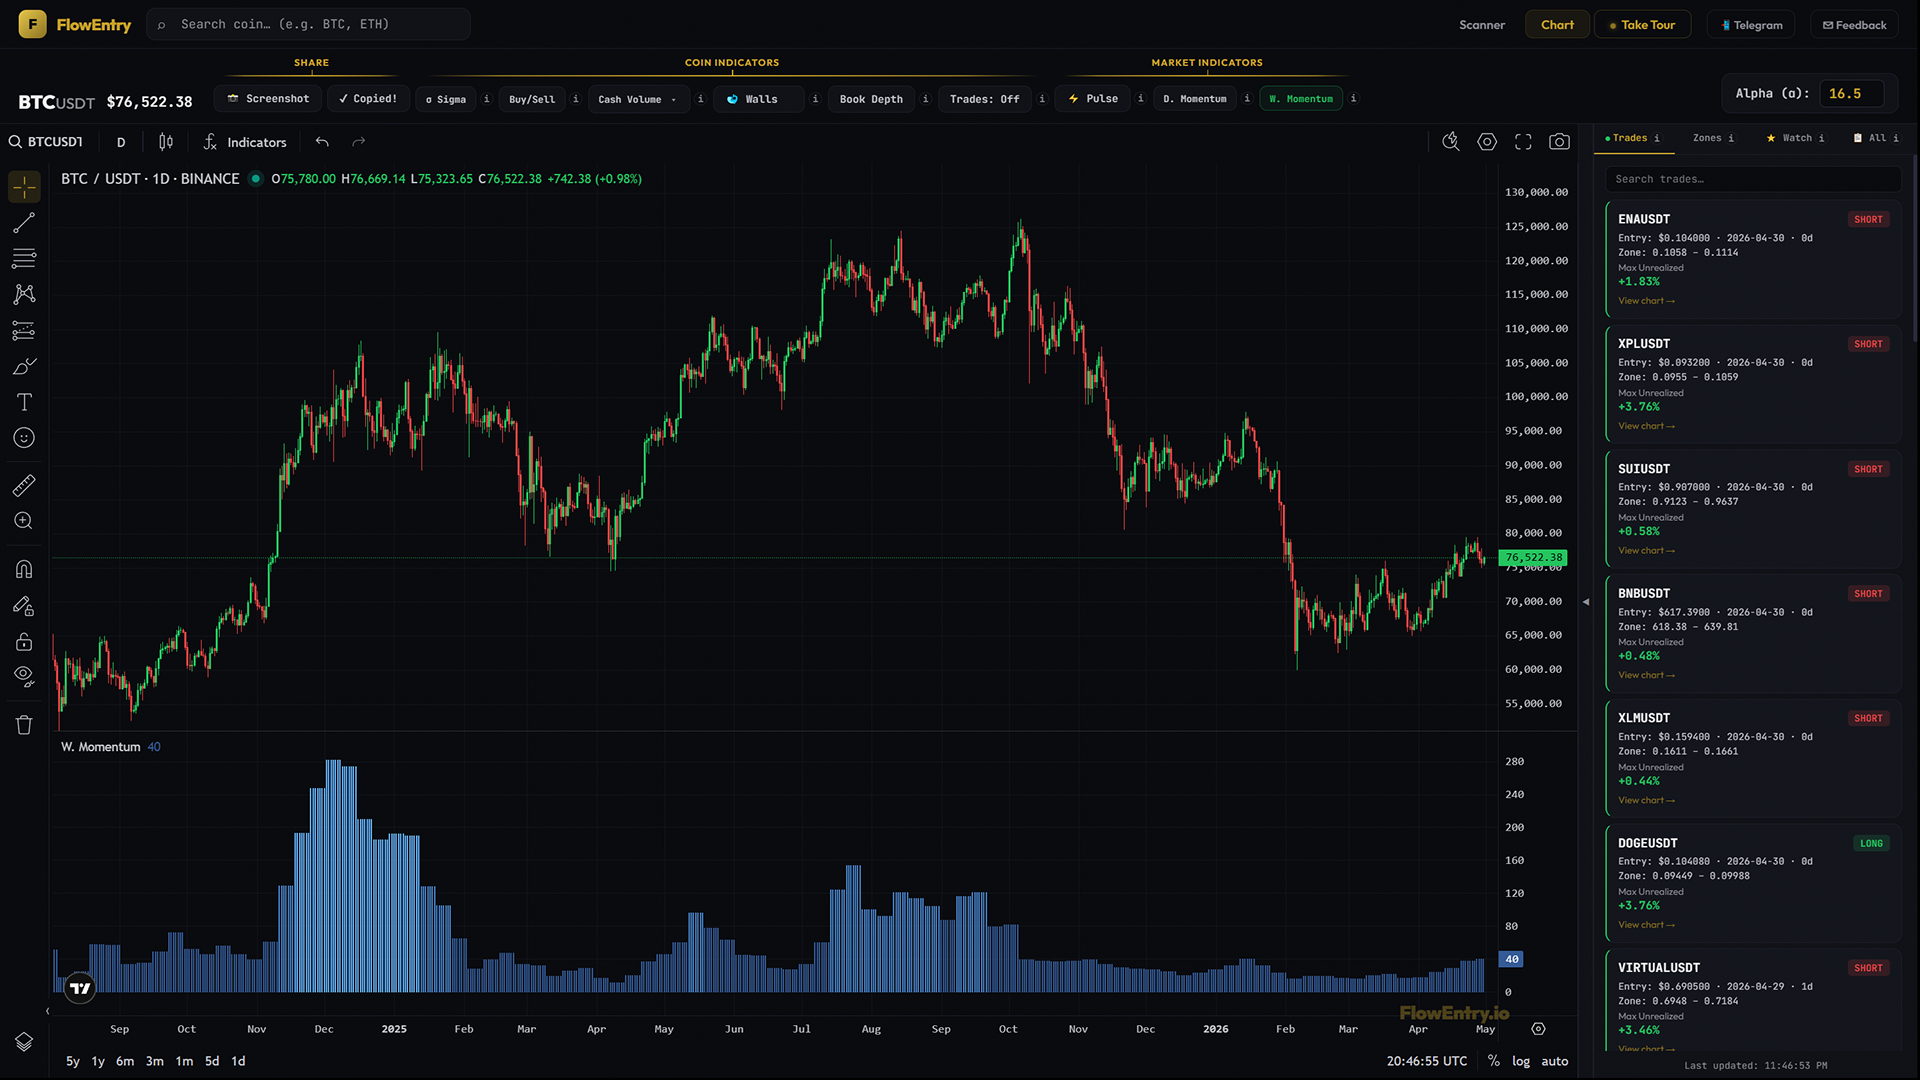
W. Momentum is the bigger-picture version of market strength. Week to week instead of day to day. Slower, harder to fake, and the best read you have on whether the broader trend is still intact.
What it answers
- “Is the bigger trend still in place, or is it quietly breaking?”
- “Is this market overheated by now, or is there still room?”
- “How long has the regime been running at this strength?”
- “Is the rotation underneath the surface broad or narrow?”
Mental model
W. Momentum is the slower, weekly version of D. Momentum. Same idea (what share of the market is positioned strong), but measured week to week instead of day to day. Single-day noise gets washed out, leaving the broader trend posture of the market. When it shifts, it is a bigger shift than a daily flip.
- Light blueMany coins holding strong week to week. Broad weekly strength. When the market has been running, light blue is also where the regime starts to look overheated. Too much of the market is too strong for too long.
- Mid blueMixed.
- Dark blueBroad weekly weakness; the longer trend is bleeding.
W. Momentum is built to read the bigger trend. D. Momentum tells you what the market is doing this week. W. Momentum tells you what the market has been doing for the last several weeks.
How to use it
W. Momentum reads cleanest at regime endpoints, bigger transitions than D. Momentum captures.
- Bear-to-bull, the bigger pictureLong downtrend, dark blue dominating for weeks. Dark blue mixes into mid blue. Mid blue gives way to light blue. The broader market has flipped to weekly strength. Often persists for weeks before price acts on it convincingly.
- Bull-to-bear, the overheating signalLong uptrend, light blue for many consecutive weeks. Persistent light blue is itself the warning. First slip from light blue to mid blue after a long light-blue run means the broader trend is losing breadth underneath. Mid blue → dark blue confirms the bigger-picture turn.
- Combining with D. MomentumLight blue + D. Momentum green is the strongest possible alignment. Light blue + D. Momentum gold/red is usually a pullback in a still-strong market, often a buy zone for trend-followers. Mid/dark blue + D. Momentum green is a counter-trend rally inside a weak bigger picture, treat with skepticism. Dark blue + D. Momentum red is genuinely weak, avoid longs.
- The Pulse confluence (high-conviction)Pulse purple zones often print right around the colour transitions in W. Momentum. When all three line up (Pulse purple + D. Momentum colour flip + W. Momentum colour flip in the same window), you are watching a market regime change in real time. Rare and high-conviction.
What it doesn’t do, and when not to use it
W. Momentum is a count, not a list of specific coins. It does not show daily moves; that is D. Momentum’s job. It does not show per-coin direction. And it is daily timeframe and above only.
Don’t use it for short-term timing. The value is regime, not entry. In a trending sideways market, all three blue tiers can flicker without meaning. Pair with D. Momentum and Pulse; if neither confirms, the W. flicker is noise.
Why it works
The weekly horizon is harder to fake than the daily. A pump-and-dump can paint one daily bar; it cannot manufacture a weekly close. W. Momentum aggregates that hard-to-fake weekly read across the entire USDT market, and the resulting blue intensity is one of the cleanest “where in the cycle are we” reads available. Built bottom-up from coin-level breadth instead of inferred from a single asset.
Examples
Case A: dark → mid → light flip ahead of a bull cycle
- Setup.
- Months of dark blue bars after a bear market.
- Signal.
- Bars shift to mid blue, then to light blue. Price has not yet broken structure up convincingly.
- Outcome.
- New uptrend confirmed weeks later.
- Lesson.
- Weekly strength reappears before price commits to the new trend.
Case B: persistent light blue → first slip = overheating warning
- Setup.
- Light blue for many consecutive weeks during an extended uptrend.
- Signal.
- First week of mid blue after the long light-blue run.
- Outcome.
- Top followed; downtrend started over the next several weeks.
- Lesson.
- The overheated regime cracked. Light blue persisting too long is itself a warning.
Case C: triple confluence (Pulse + D + W flipping together)
- Setup.
- Long dark-blue regime.
- Signal.
- Pulse prints purple, D. Momentum flips red → gold → green, W. Momentum flips dark → mid → light blue, all within a few weeks.
- Outcome.
- New uptrend, durable.
- Lesson.
- When all three indicators confirm a regime change, the change is real.
Case D: D. flipped, W. didn’t (counter-trend rally)
- Setup.
- W. Momentum dark blue, D. Momentum prints a stretch of green.
- Signal.
- D. green did not pull W. up out of dark blue.
- Outcome.
- Counter-trend rally faded; downtrend resumed.
- Lesson.
- Daily strength inside weekly weakness is usually a bounce, not a turn.