Coin Indicator
Trade Markers
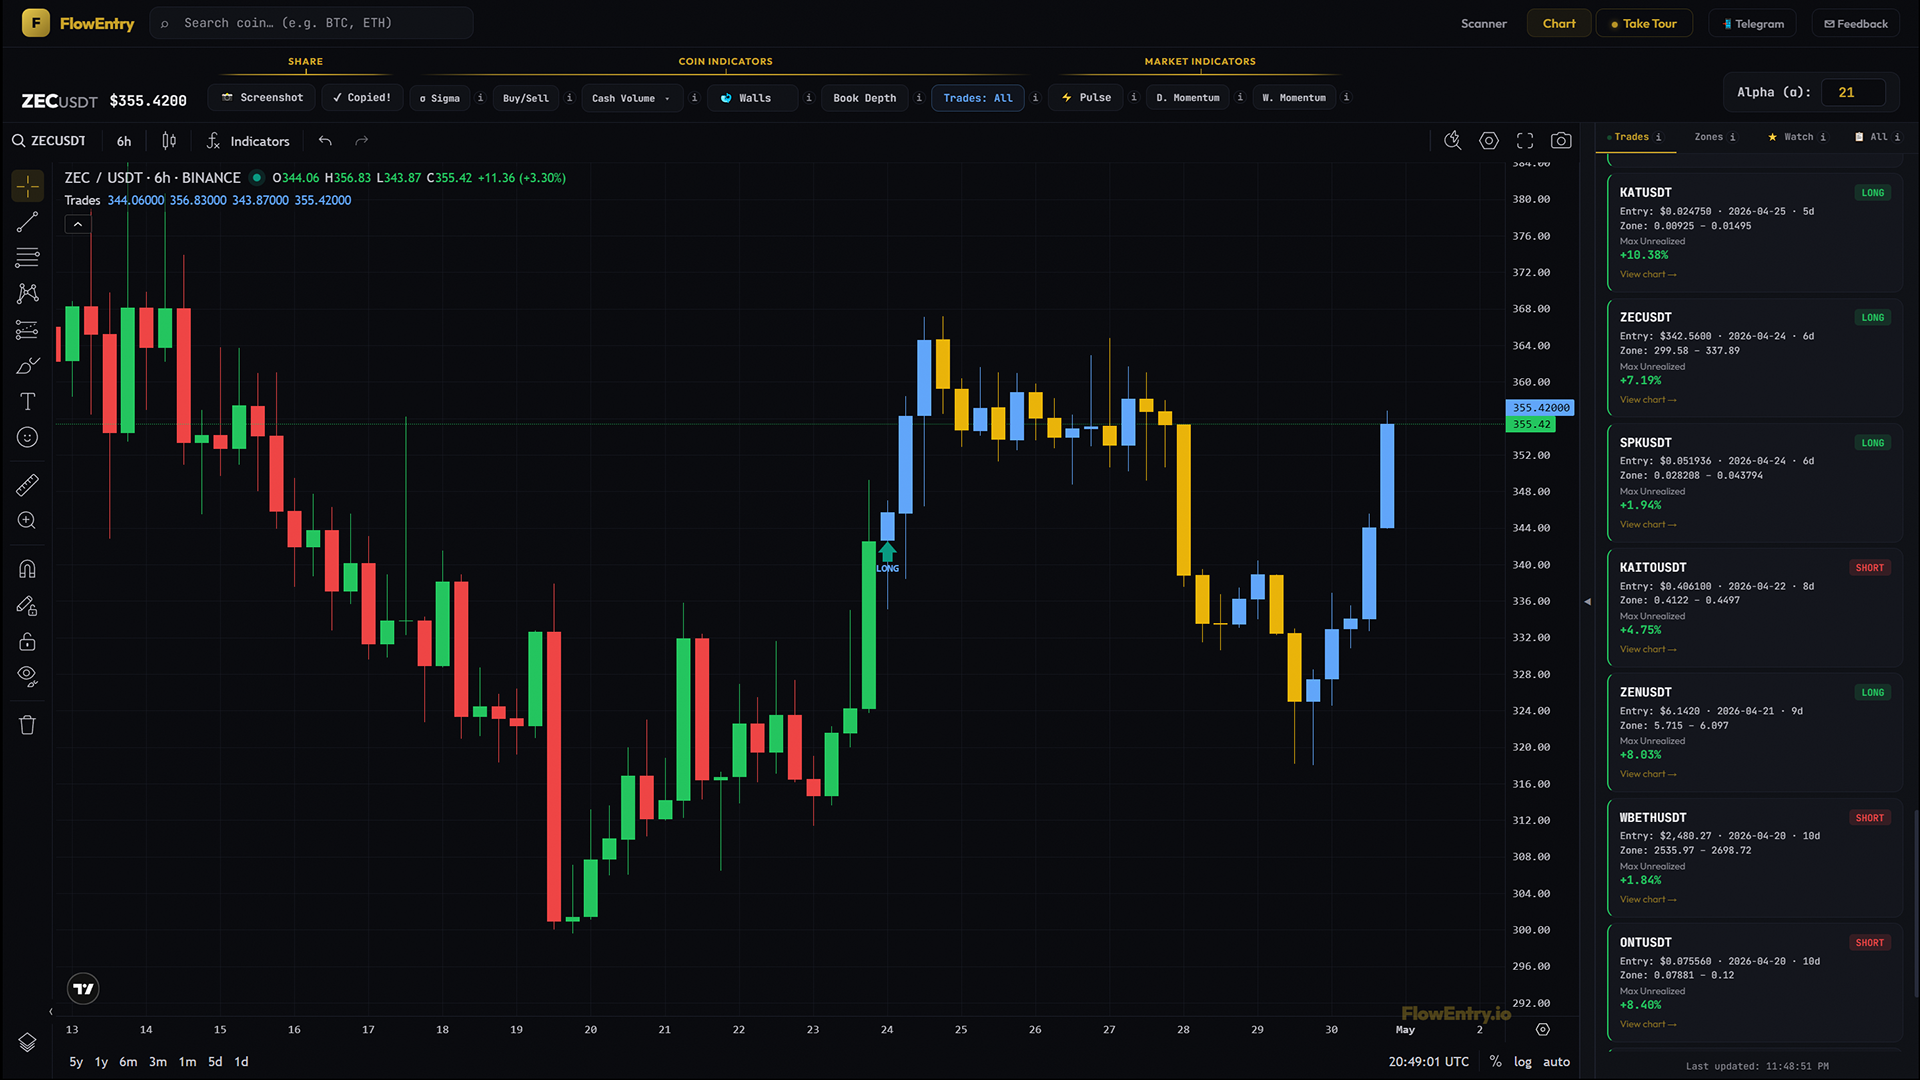
Trade Markers prints every trade the FlowEntry bot has taken on this coin directly onto the chart. Entries, exits, and the percentage each one reached at its peak.
What it answers
- “Has the bot ever traded this coin? How did those trades go?”
- “Is the bot in a trade on this coin right now?”
- “What was the best paper P&L this trade reached, not just where it ended?”
- “Does the strategy work on this specific coin’s chart, or does it bleed?”
- “Where exactly did entries trigger relative to the Sigma zone?”
Mental model
Trade Markers shows you, on the chart, every trade the FlowEntry bot has actually taken on this coin, past and present. Coloured arrows mark entries. Emoji dots mark exits, with the max paper-profit each trade reached printed next to them. While a trade is currently open, every candle from entry forward is repainted blue (up bars) or gold (down bars) so you can see, at a single glance, that this coin is live in the bot’s book.
You are not reading what the bot might do. You are seeing what it did. The recolour ends the moment a trade closes. The next zone, the next trade, the next colour roll begins on its own day. Every emoji on the chart is a real outcome, every percentage is a real number.
How to use it
- Visual track record per coinSet mode to “Trades: All” and scroll back. Every gold zone the bot acted on shows up as an arrow plus an exit dot with its max-unrealized %. You see the strategy’s behaviour on this exact coin without reading a backtest table.
- Confirm the bot’s read in real timeSet mode to “Trades: Current”. If the candles are blue/gold-painted forward, you and the bot are in the same trade. If not, the bot has nothing on this coin right now. That is an honest answer too.
- Validate Sigma in practiceSigma plus Alpha generates the zone; the bot acts on the daily close. The arrows on the chart are the strategy’s literal verdict on whether the zone produced a confirmed move.
- Spot whipsawsA coin that triggers multiple stop-and-reverse trades in a short window, visible as alternating arrows with small max-unrealized, is a coin where the strategy is whipsawing. Tread carefully or skip.
- Read max-unrealized as “what was on the table”The number next to the exit emoji is the trade’s peak paper P&L while it was open, not the realised exit P&L. It tells you the size of the move that played out, separate from how the bot handled exits.
- Combine with zones and SigmaThe bot’s zone is identical to a Sigma gold zone. Trade Markers plus Sigma on the same chart shows the full pipeline: gold zone (signal generated) → arrow (signal acted on) → recolour (still in the trade) → exit emoji plus percentage (outcome).
What it doesn’t do, and when not to use it
Trade Markers does not place trades for you. It is a visualisation of the bot’s own paper portfolio. It is also not personalised; every paid user sees the same trades. And it does not back-test counterfactuals; if the bot’s rules change, only future trades reflect the new rules.
Don’t use it as a leading indicator; every arrow marks a decision already made. Don’t treat it as a green-light to mirror trades blindly; the track record is the strongest available evidence, not a promise. And don’t read fast intraday entries off the chart; the bot only acts on daily closes.
Why it works
Most trading tools show you what might happen. Trade Markers shows you what did happen, on this exact coin, executed by a deterministic bot following the same rules across all 600 pairs. The recolour-while-open is the strongest possible “the bot is in this right now” signal, and the exit dot plus max-unrealized number turns every closed trade into an evaluable data point. There is no theoretical claim. Only the bot’s actual book, drawn on the chart.
Examples
Case A: clean LONG win
- Setup.
- A coin printed a Sigma gold day; a zone was created.
- Signal.
- Daily close broke above the zone. Blue LONG arrow plus candle recolour started.
- Outcome.
- Trade closed at a higher price; exit shows 🟢 plus a max-unrealized like +12.4%.
- Lesson.
- Sigma signal → zone → confirmed breakout → realised move on the chart.
Case B: stop-and-reverse that worked
- Setup.
- A coin entered LONG above a zone, but a later daily close fell below the zone low.
- Signal.
- Red exit emoji on the LONG (with the long’s max-unrealized), then a new red SHORT arrow at the same close price.
- Outcome.
- Short ran; closed with green 🟢 (because direction matters, not entry colour).
- Lesson.
- The stop-and-reverse mechanic is the strategy’s response to a failed breakout, not a bug.
Case C: whipsaw cluster
- Setup.
- A coin ranging tightly around a zone for several days.
- Signal.
- A run of small arrows alternating direction with low max-unrealized values (+1.2%, -0.8%, +0.6%, …).
- Outcome.
- Net small drawdown.
- Lesson.
- Some coins whipsaw the strategy. The chart makes that obvious. Skip them or size accordingly.
Case D: open trade in progress
- Setup.
- A coin currently has blue/gold candles painted from N days back to today.
- Signal.
- One blue LONG arrow at the entry, no exit emoji yet.
- Outcome.
- TBD.
- Lesson.
- This is the bot’s live position. Cross-reference against current Sigma plus Buy/Sell plus Cash Volume to decide whether to mirror, skip, or watch.