Coin Indicator
Buy / Sell
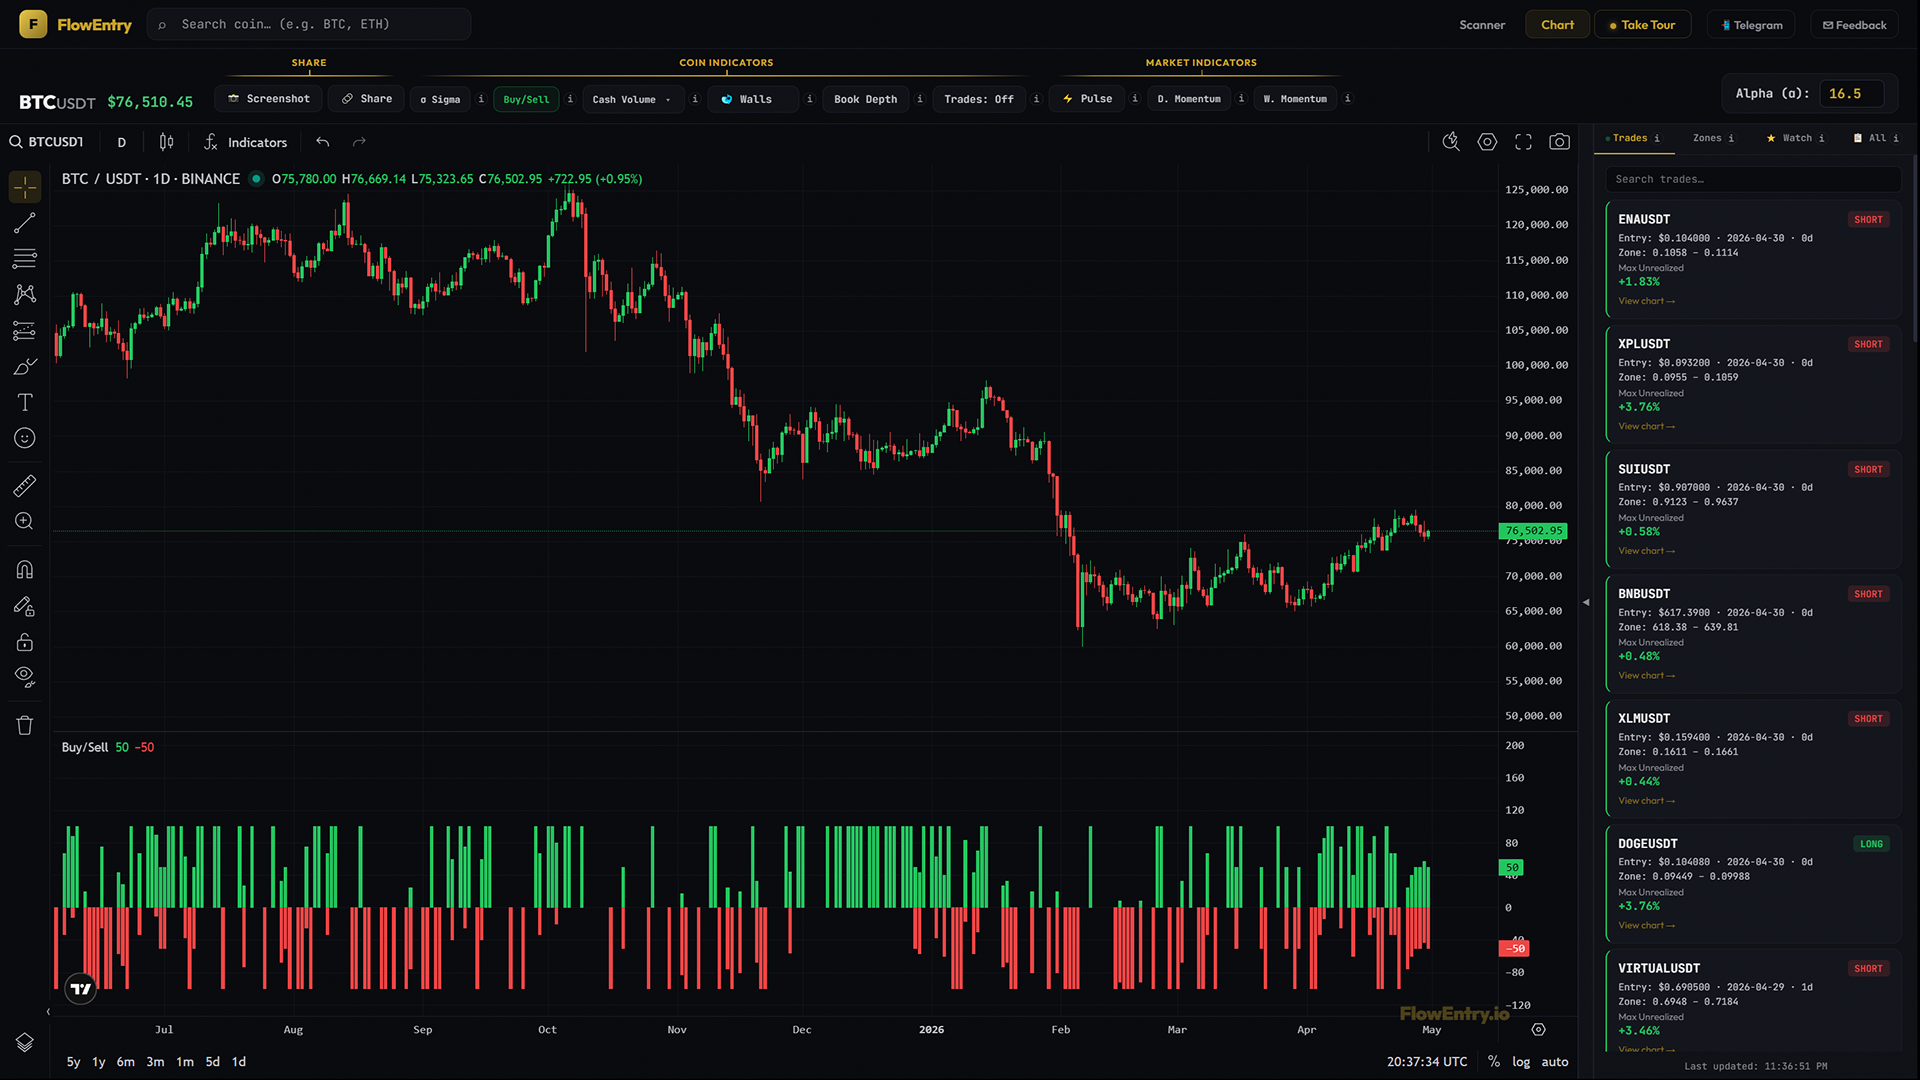
Sigma tells you something happened. Buy/Sell tells you which side made it happen.
What it answers
- “On this hot day, was the unusual activity buying or selling?”
- “Is this run-up still being absorbed by buyers, or have sellers started taking control?”
- “Did the breakout day actually have buy-side flow behind it, or were sellers winning the tape?”
- “Is this drop capitulation (red dominant) or distribution into demand (mixed)?”
Mental model
Buy/Sell takes Sigma and splits it open. Sigma tells you how many unusual flow events happened. Buy/Sell tells you which side did them.
A gold sigma day with the histogram leaning hard green means the unusual activity was overwhelmingly buying. Hard red means overwhelming selling. A gold day with both bars roughly even is unusual two-way activity, neither side took control.
You don’t read order books. You watch the colour underneath the gold.
How to use it
Buy/Sell on its own is a curiosity. Buy/Sell on top of a gold Sigma day is a signal.
- Confirm direction at breakoutPrice breaks a level and closes outside, Sigma is gold, Buy/Sell is dominant on the breakout side. Real flow agrees with the move. If Buy/Sell is dominant the opposite way on a breakout day, that breakout is suspicious. Someone large is fading the move.
- Detect absorptionPrice holding a level despite obvious selling pressure, Sigma gold, Buy/Sell heavy red. Sellers are unloading but somebody is eating it without the price breaking. That somebody is the side you want to be on.
- Detect exhaustion or distributionAfter a strong run-up, gold Sigma starts printing with Buy/Sell flipping toward red, or going mixed. The side that drove the move is no longer in control. Treat it as a warning, not a guarantee.
- Disqualify noise ralliesA coin pumps but Sigma stays gray, or Sigma is gold but Buy/Sell is mixed/red. The rally has no real one-sided buying pressure. Do not chase.
- Read capitulationDuring a sharp drop, gold Sigma plus extreme red Buy/Sell is forced selling. Often marks short-term lows once the next day’s split goes mixed or green.
What it doesn’t do, and when not to use it
Daily timeframe and above only. Same rule as Sigma. The split is computed per UTC day. Intraday timeframes render correctly visually but are meaningless.
Buy/Sell shows direction only, not magnitude. The bars are percentages and always sum to 100%. To read magnitude, look at Sigma (event count) or Cash Volume (dollar size).
Why it works
The split is not editorial. It is a direct count of which side triggered the unusual events that day. There is no smoothing, no weighting, no opinion. If twelve unusual events fired and ten were buying, the bar reads ~83% green. The Buy/Sell histogram is the closest you get to looking the day’s order flow in the eye without staring at a tape.
Examples
Case A: confirmed breakout
- Setup.
- A coin consolidating below resistance for many days.
- Signal.
- Breakout day prints gold Sigma plus Buy/Sell ~85/15 green.
- Outcome.
- Trend continued for several days.
- Lesson.
- Sigma plus dominant green means the breakout has fuel.
Case B: failed breakout faded by sellers
- Setup.
- A coin broke a key level with visible price acceleration.
- Signal.
- Sigma gold but Buy/Sell ~30/70 red on the breakout day.
- Outcome.
- Reverted within 1 to 2 days.
- Lesson.
- Real money was on the other side of the move. Watch direction, not just gold.
Case C: absorption pattern
- Setup.
- A coin holding a support zone despite obvious supply.
- Signal.
- Three days of gold Sigma with Buy/Sell heavy red, but price not breaking down.
- Outcome.
- Sellers exhausted; reversal followed.
- Lesson.
- When sellers can’t break price despite dominant red, somebody is absorbing them.
Case D: distribution into a top
- Setup.
- A coin had run up significantly over many days.
- Signal.
- Gold Sigma days flip from green-dominant to mixed/red while price keeps drifting up.
- Outcome.
- Top printed within days.
- Lesson.
- The buy side hasn’t disappeared, it’s selling into late retail. Direction shifts before price does.