Market-Wide Indicator
D. Momentum
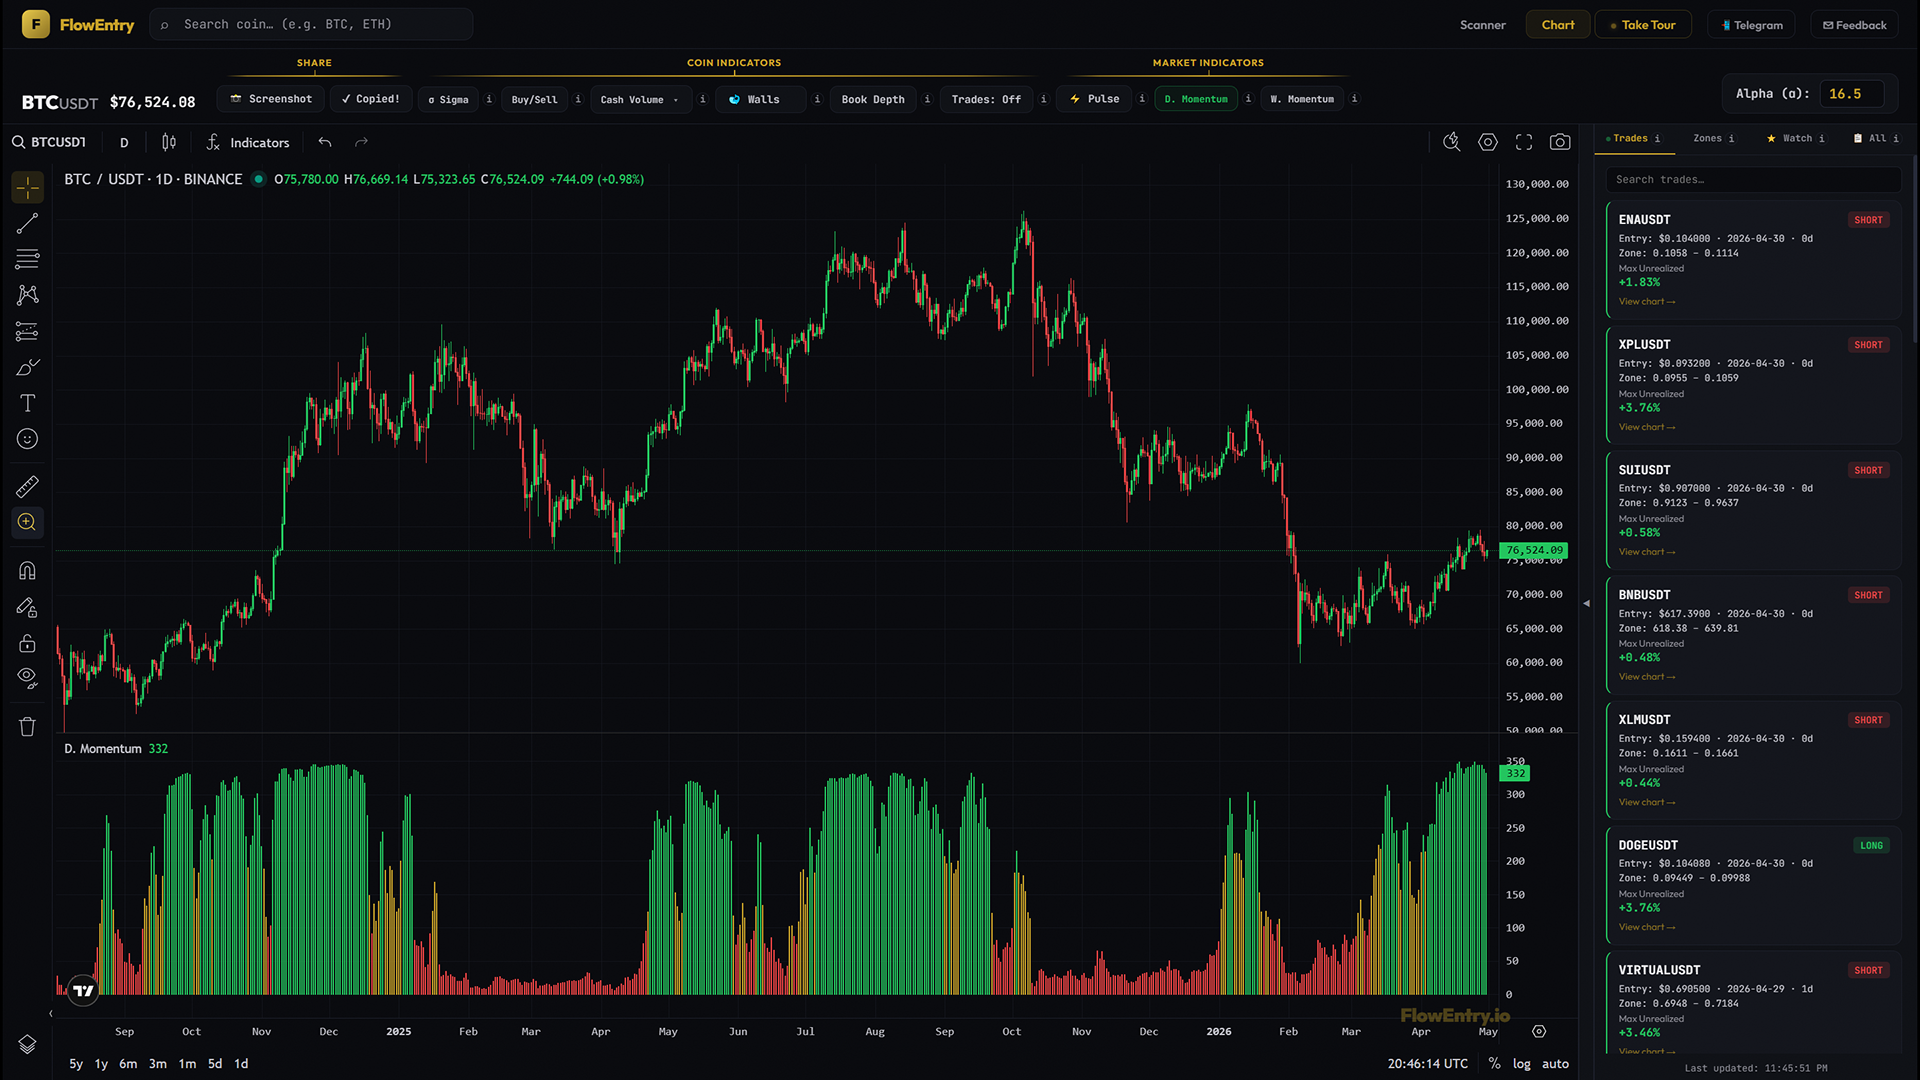
D. Momentum tells you, every day, what share of the market is positioned strong. Green when the market is leaning up, red when it is leaning down, gold when it can’t decide.
What it answers
- “Is the market actually positioned up right now, or is it just a bounce?”
- “How long has the market been in this regime?”
- “Are we early in a trend, late, or already past the rotation?”
- “When did the market quietly flip before price did?”
Mental model
D. Momentum is a daily score of how much of the market is positioned strong. Every day, FlowEntry checks each USDT coin against its own internal momentum benchmark. The bar is the count of coins that passed. The colour tells you the breadth at a glance:
- GreenMost coins strong. Broad market is positioned up.
- GoldMixed. Market is undecided.
- RedMost coins weak. Broad market is positioned down.
It changes slowly because the underlying measure is intentionally smoothed. D. Momentum is built to read trend posture across the whole market, not single-day moves. When the colour turns, it usually turns before price does.
How to use it
The colour cycle tends to repeat across cycles, and it leads price more often than it lags. The most useful trades come at the colour-flip points, not in the middle of a colour run.
- Bull cycle starting (the early signal)Long downtrend, bars mostly red. Red mixes into gold as some coins repair their charts. Gold turns into a run of long green bars. Most of the market is positioning up. Price has often not yet moved meaningfully.
- Bear cycle starting (the late-stage warning)Long uptrend, bars mostly green. Green shifts toward gold as more coins lose strength. Gold flips into a stretch of red. Price often has not broken down yet when this colour shift happens.
- The Pulse confluencePulse purple printing while D. Momentum colour is shifting means market-wide unusual flow is happening and the daily strength regime is rotating. The two indicators agreeing tightens the signal massively.
- The four high-level casesGreen + Sigma gold = strong setup, coin is acting in a strong-positioned market. Green + Sigma gray = coin is missing the rotation. Red + Sigma gold = coin unusually strong against a weak market, often a leadership tell. Red + Sigma gray = quiet coin in a weak market, usually nothing to do.
What it doesn’t do, and when not to use it
D. Momentum is a market-wide percentage and count, not a list of specific coins. It tells you breadth, not magnitude. It does not tell you the direction of any individual coin. And it does not work intraday. One value per UTC day.
Don’t use it as a precision entry trigger. It is a regime read, not a level tool. And don’t lean on a single green bar mid-uptrend. The transitions are where it is most predictive.
Why it works
Most “market strength” indicators are built on a single asset (BTC, an index) and inherit that asset’s quirks. D. Momentum is built bottom-up: it asks each USDT coin independently whether it is positioned strong, then aggregates the answer. Coins lead and lag at different times, so the broad count flips before any single chart does. That is why the colour transitions are early. They capture the breadth of positioning, not the price action of any one symbol.
Examples
Case A: red → gold → green flip ahead of a market low
- Setup.
- Months of red bars during a downtrend.
- Signal.
- Bars shift to gold, then a run of long green bars. Price has not yet broken structure up.
- Outcome.
- Market low followed; trend reversed.
- Lesson.
- The colour flipped before the chart did. Watch for it.
Case B: green → gold → red flip ahead of a market top
- Setup.
- Months of green bars during an uptrend.
- Signal.
- Green shortens, gold dominates, then a stretch of red. Price is still drifting up.
- Outcome.
- Top printed within days; downtrend started.
- Lesson.
- Strength left the market underneath. The colour told you before price did.
Case C: Pulse + D. Momentum confluence
- Setup.
- Long red regime. Pulse mostly slate.
- Signal.
- Pulse prints two purple zones in three days, and D. Momentum flips red → gold → green over the same window.
- Outcome.
- New uptrend confirmed within a week.
- Lesson.
- When unusual flow and broad strength flip together, it is the strongest regime-change signal the app can give.
Case D: false flip (whipsaw)
- Setup.
- Bars flip red → gold → green for a few days, then back to red.
- Signal.
- No follow-through; Pulse stayed cold throughout.
- Outcome.
- Failed flip; downtrend resumed.
- Lesson.
- A colour flip without Pulse confluence is weaker. Wait for the second indicator before sizing up.