Discovery
Scanner History
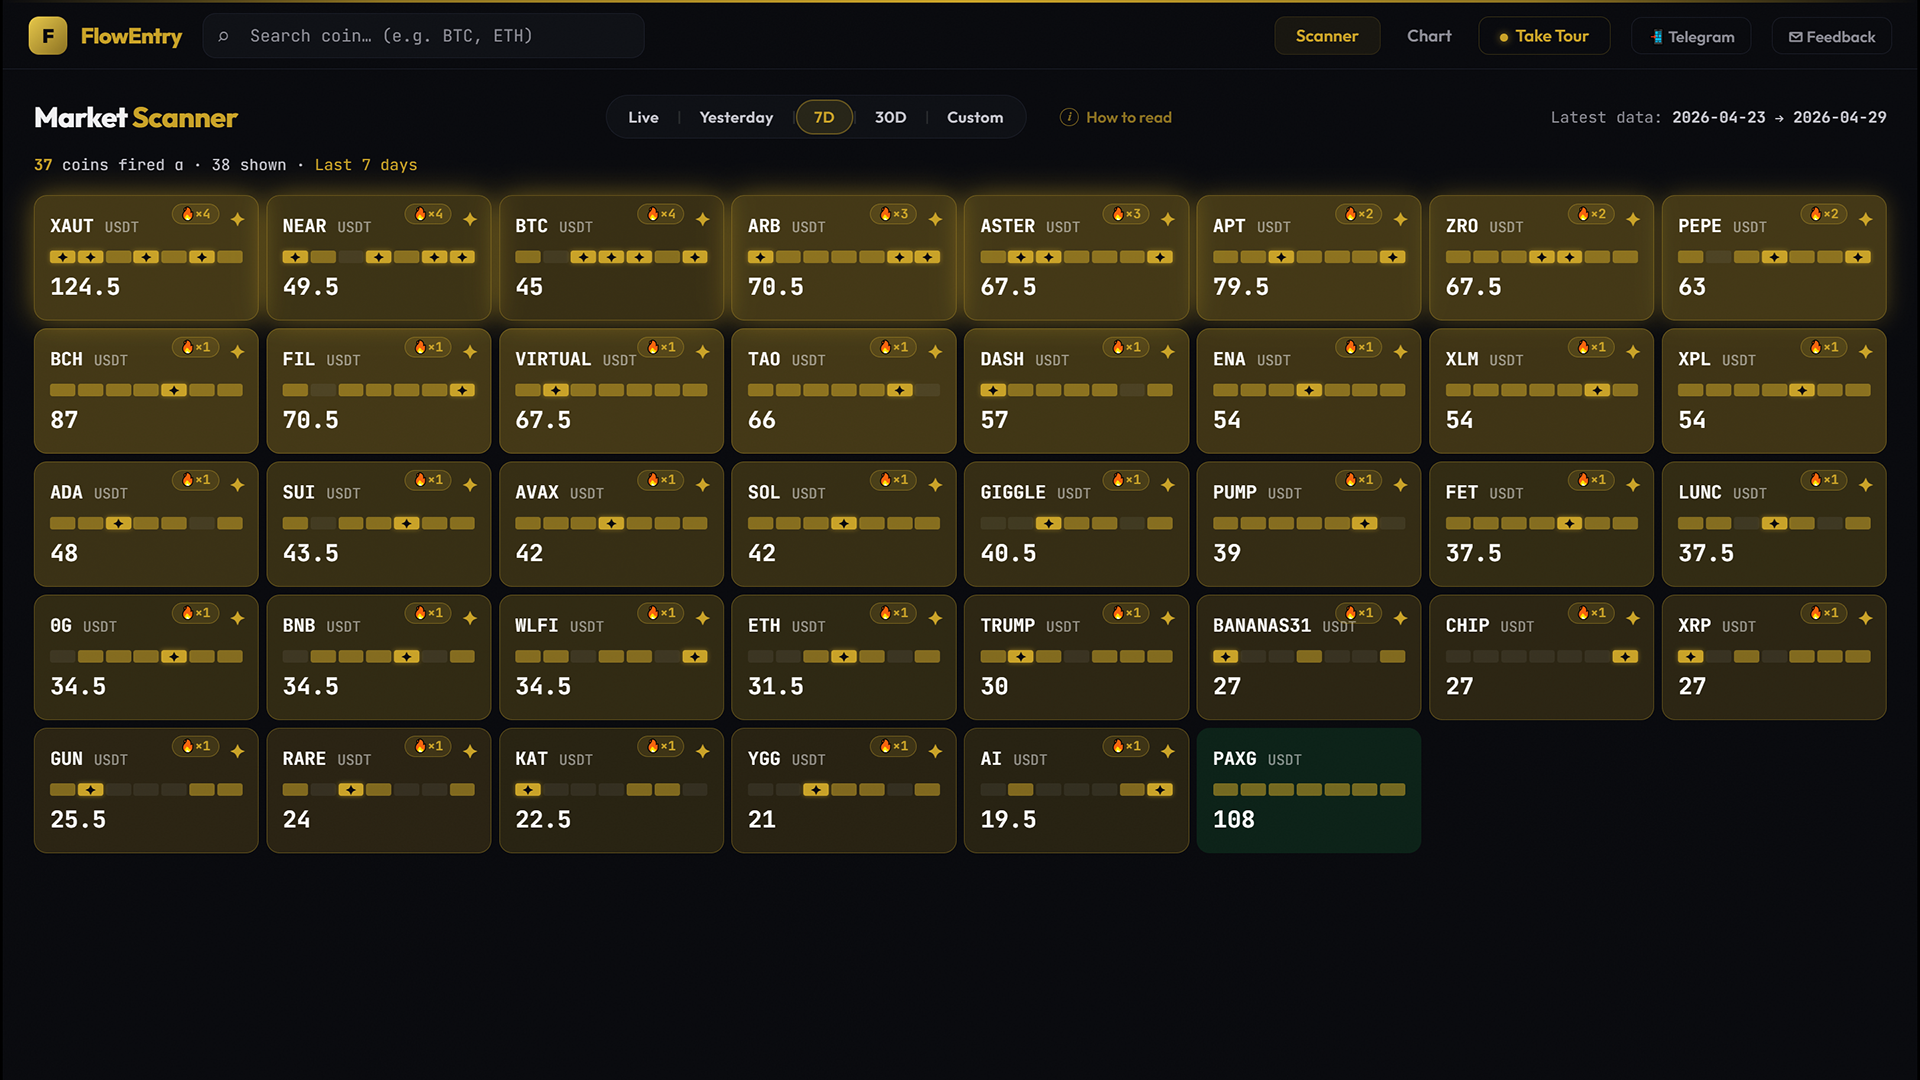
Range mode is the historical lens of the Scanner. Switch the pill to 7D or 30D and the same heatmap surfaces the coins that have been consistently firing, not just whoever popped today.
What it answers
- “Which coins have been firing the most over the past week?”
- “Is this coin a one-day pop or a recurring mover?”
- “After last week’s regime change, who actually led?”
- “What was happening during this date range?”
- “Are the leaders today the same coins that were leading 7 days ago?”
Mental model
Range mode answers “who has been firing across this window?” Live tells you what is loud right now. Range tells you who has been consistently loud. Each tile in range mode carries three layered reads:
- Total σMagnitude across the range.
- 🔥×NCount of days fired α. Consistency.
- SparklineWhen those fires happened. Pattern.
A coin with 🔥×5 in 7 days has been firing nearly every day. A trend, not a pop. A coin with the same total σ but 🔥×1 had one big day and six quiet ones. A pop, not a trend. Same number on the tile, completely different setups. The sparkline is the difference.
How to use it
- Find the trend coins, not the pop coinsSet the pill to 7D. The first row of tiles is the most-consistently-firing coins of the past week. 🔥×5 over 7 days is trend day after day. 🔥×1 with high σ is a single pop, mostly noise. Always click 🔥×3+ tiles first.
- Read the sparkline as patternTwo coins with 🔥×4 in 7D might look identical on the badge, but the sparkline shows the shape. Four consecutive fires is a strong continuous run. Four scattered fires is on-and-off interest. The shape changes the read entirely.
- 30D for cycle leadersSwitch to 30D after a regime change (Pulse clusters, W. Momentum light blue arriving). The 🔥×N badges show which coins led the rotation. These are the candidates to watch in the next regime.
- Custom for postmortemPick a custom date range from the picker, e.g. the date range of a recent BTC pump. The Scanner shows you which alts were firing during that window.
- Compare Live to 7D for rotation readsOpen Live, screenshot the top tiles. Switch to 7D, screenshot again. Different leaders = rotation in progress. Same leaders = trend continuation.
- Yesterday for “did the regime change overnight?”Yesterday is the single-day-shifted version of Live. Useful when you missed a day’s market and want to scan it post-hoc.
What it doesn’t do, and when not to use it
Range mode does not show direction; σ counts are direction-agnostic. It does not show the book; book ratios are a single-day snapshot and are hidden when the Scanner is showing a range. Server caps at 31 days. For longer historical analysis, use the chart’s Sigma histogram. Range mode is signal data, not strategy data; for per-coin profitability of trades, use Trade Markers.
For “what is happening right now”, use Live. For coins outside the top 38 of the range, navigate via search. For very recent setups (last few hours), use Live or the chart’s σ histogram.
Why it works
Live is necessary but not sufficient. Crypto rotates quickly; yesterday’s leader can be today’s laggard. The historical pills let you separate signal from noise: a coin that fires 5 days out of 7 is trying to tell you something the way a single-day pop never can. The sparkline turns the firing pattern into a shape your eye can read in half a second. The 🔥×N badge gives you a single integer to compare across the entire universe.
Examples
Case A: trend day vs pop day
- Setup.
- 7D pill active. Two tiles have similar total σ.
- Signal.
- Tile A shows 🔥×5 with a sparkline of 5 consecutive fires plus 2 cold days. Tile B shows 🔥×1 with one big fire plus 6 cold days.
- Outcome.
- Tile A is in a trend; Tile B had one news pop.
- Lesson.
- Same total σ, completely different setups. The 🔥 count and sparkline shape are the differentiators.
Case B: rotation read (Live vs 7D)
- Setup.
- Live shows X, Y, Z as the leaders. Switch to 7D and leaders are A, B, C.
- Signal.
- Today’s leaders aren’t last week’s leaders.
- Outcome.
- Rotation in progress. Today’s leaders are the new candidates; yesterday’s may be over.
- Lesson.
- Compare Live vs 7D regularly to read whether the universe of active coins is shifting or holding.
Case C: custom range postmortem
- Setup.
- BTC ran 12% over a 4-day window last week. Pick that exact range with Custom.
- Signal.
- Scanner shows which alts fired α during the window.
- Outcome.
- A short list of coins that moved with the wave.
- Lesson.
- Custom range plus 🔥×N is the cleanest postmortem the app produces.
Case D: 30D leader read after a regime change
- Setup.
- W. Momentum just flipped from dark blue to light blue.
- Signal.
- 30D pill shows several coins with 🔥×8, 🔥×6 over the past month, the leaders during the transition.
- Outcome.
- These coins are the candidates to watch first as the new regime extends.
- Lesson.
- The market remembers its leaders.