Pro Feature
Alerts
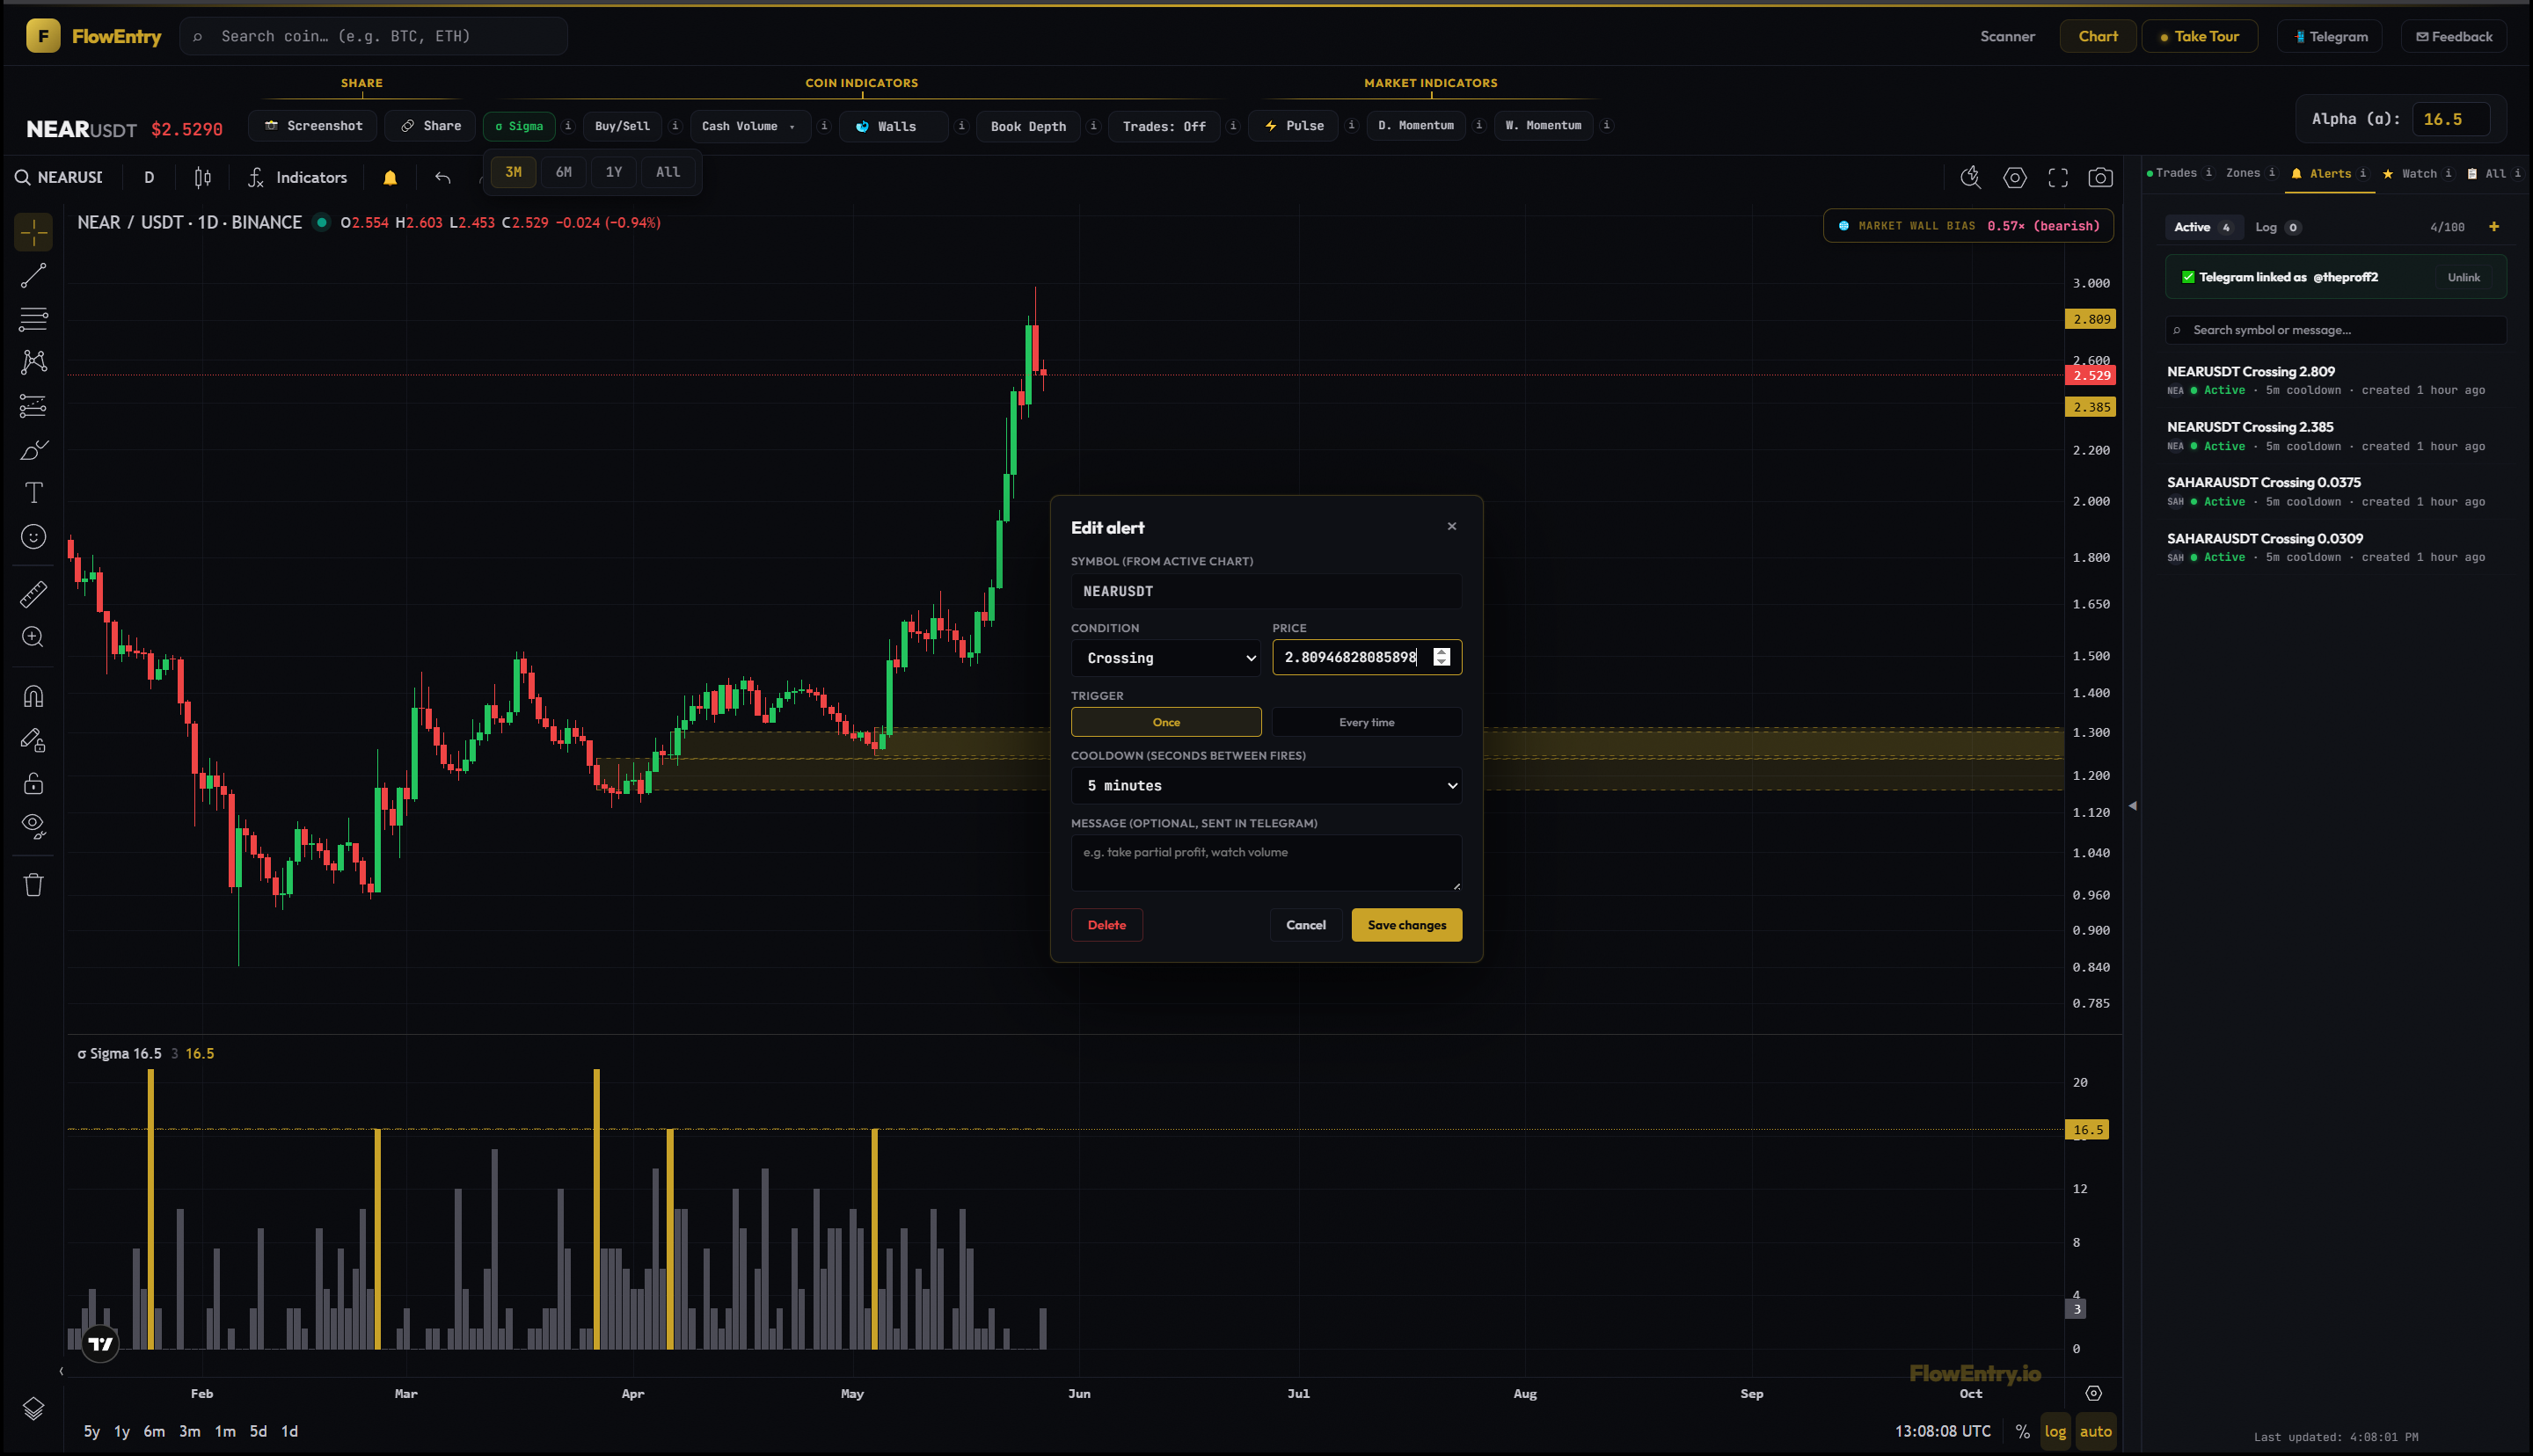
Set a flat price or draw a sloped trendline. The moment Binance prints a tick that matches your condition, FlowEntry raises a centered fire-toast in the app and sends a Telegram message from @flowentry_alert_bot.
What it answers
- "I don’t want to stare at the screen — wake me when X happens."
- "How do I track 30 setups without 30 tabs open?"
- "Did this zone break, or did it hold while I was asleep?"
- "I’m only interested in this coin if it closes above $X on the daily."
- "I have a diagonal support line drawn — tell me the moment it breaks."
- "Where on the chart did I set alerts on this coin?"
Mental model
Alerts are how FlowEntry talks back when you’re not looking. You set a level — either a flat price (above, below, crossing, daily close) or a diagonal trendline you draw with two clicks — and you walk away. The moment Binance prints a tick that matches, two things happen at the same time: the app pops a centered fire-toast in front of you, and Telegram sends you a message from @flowentry_alert_bot. The toast stays on screen until you dismiss it, designed to be impossible to miss.
Each active alert leaves a marker on the chart. Price alerts show as a gold tag on the price scale; trendline alerts show as a locked gold line between your two anchors, recoloured orange after it fires or grey if your tier expired. The line stops where you drew it, but the math behind it keeps going — so if price crosses the projected line tomorrow, you still get pinged.
A hundred alerts max across both types, repeat-with-cooldown or once-and-done, custom message per alert. This is your idle layer. The chart is for active reads; alerts are for the rest of the day.
The twelve conditions
Seven price-based, five trendline-based. Price conditions test against a flat number; trendline conditions test against the line’s value at the moment of evaluation.
- Above / BelowPrice condition. Fires the first tick where price meets or exceeds the threshold (Above) or falls to or below it (Below). The classic "let me know if it gets here" alert.
- CrossingPrice condition. Fires when price crosses the threshold from either side. Useful for ranges and pivots.
- Crossing Up / Crossing DownPrice condition. Directional crossings. Crossing Up fires only on a low-to-high cross; Crossing Down only on high-to-low. Filters out the other direction’s noise.
- 1D Close Above / 1D Close BelowPrice condition. Fires on the UTC daily close event itself, only if the closing price meets the threshold. The discipline alert for traders who refuse to react to intraday wicks.
- Trendline CrossingTrendline condition. Fires when price crosses the projected line, either direction. The diagonal version of Crossing.
- Trendline Crossing Up / Trendline Crossing DownTrendline condition. Directional. Crossing Up for resistance breaks (price moves from below the line to above); Crossing Down for support breaks (above to below). Same noise-filtering logic as the flat versions, applied to a slope.
- Trendline 1D Close Above / Trendline 1D Close BelowTrendline condition. Fires on the UTC daily close only if the closing price sits the right side of the line at that moment. The discipline cousin: trendline breaks confirmed by a daily close, not an intraday poke.
Once vs Repeat (and cooldown)
Once fires the first matching tick, then flips to Triggered and stops checking. You re-enable it manually from the alert row (▶ button) when you want it back.
Repeat stays active across fires. To stop a Crossing alert from firing on every flicker in a flat market, each fire stamps the alert and subsequent fires are suppressed until your cooldown elapses. Cooldown ranges from zero to twenty-four hours per alert.
How to use it
- Watch a zone edge without watching the chartOpen a coin with a Sigma gold zone. Right-click the zone’s high in the chart and pick "Create alert here..." with 1D Close Above. You’ll get pinged the moment the bot’s daily-close stop-and-reverse logic would fire.
- Stalk a whale wallWhale Walls shows a thick cyan line at $X. Right-click $X and set a Crossing alert. If price gets there and either bounces or breaks through, you’ll hear it.
- Catch a diagonal breakBell button at the top of the chart → "Trendline alert" → click two points to draw a sloped support or resistance line. Pick Trendline Crossing Down for a support break, Trendline Crossing Up for a resistance break. The line stays on the chart in gold; if price crosses the projected line even months past your second anchor, you still get the fire.
- Keep a trendline aligned as the market movesOpen the alert from the sidebar list, click "Re-anchor on chart", click two new points. Your condition, cooldown and message stay; only the anchors change. The chart marker recolours and the math re-projects from the new pair.
- Track thirty coins at onceBulk-set Crossing alerts on every coin you care about. The 100-alert cap is generous on purpose. Each fire arrives with the custom message you wrote, so you remember why you set it.
- Build a daily-close disciplineDay-traders who keep getting wicked on intraday spikes can use 1D Close Above and 1D Close Below to make decisions only on the closes that actually matter. The trendline equivalents fire only when the daily close sits the right side of the line.
- Run alerts as your only channel while travellingLink Telegram once from the Alerts tab. Every fire arrives as a push notification on your phone. The in-app fire-toast is the at-desk catch; Telegram is the away-from-keyboard channel.
The four ways to create an alert
- Bell button (chart header) → Price alertTop of the chart, opens a small dropdown. Pick Price alert to open the Create modal pre-filled with the current symbol. The fastest path when you already know the price.
- Bell button (chart header) → Trendline alertSame dropdown, second option. Drops you into place mode: a gold banner pins to the top of the chart, your cursor becomes a crosshair, and you click two points to anchor the line. A dashed gold rubber band tracks the cursor between click 1 and click 2. ESC anywhere cancels. Then the Create modal opens with the anchor summary and the five trendline conditions.
- Right-click on the chartRight-click anywhere on the price pane and pick "Create alert here..." — the threshold is pre-filled with the price you clicked. The fastest path when the level is something you’re reading from the chart (zone edge, wall, support, resistance). Price alerts only.
- The + on the price scaleA small + appears on the right-hand price scale when your cursor is over the main price pane. Click it to open the Create modal at the cursor’s price. Hidden when you hover sub-panes (Sigma, Pulse, etc.) so it doesn’t pop on the wrong axis. Price alerts only.
Trendline alerts in detail
A trendline alert is anchored by two (time, price) points you pick on the chart. The line is locked the moment you finish drawing — you can’t accidentally drag it. It shows in gold while active, orange after it fires, and grey while your tier is expired. Paused and triggered lines still render so you can see what you set; only the colour changes.
The line stops visually at your second anchor, because forward tails make the chart messy. The math behind the alert keeps going forever — so a line you anchored to two swing lows last month still fires when price breaks the projected continuation today.
If the market moves and the line no longer fits, you don’t need to delete the alert and rebuild. Open it from the sidebar list and click Re-anchor on chart. The line goes away, place mode re-opens with the same banner, and your two new clicks become the new anchors. Your condition, trigger mode, cooldown and custom message all carry over untouched. ESC during re-anchor restores the original anchors — nothing is lost unless you finish a fresh pair.
Two delivery channels (independent)
The in-app fire-toast is centered, persistent, and waits for you to dismiss it. It shows the symbol, the condition that fired, the threshold, and the custom message you wrote.
The Telegram message goes to @flowentry_alert_bot after a one-time link step in the Alerts tab. The two channels are independent on purpose: if Telegram is offline or you blocked the bot, the fire still raises the toast and lands in the History sub-tab.
What happens when your subscription expires
Auto-paused, never deleted. The Alerts tab shows a banner with the count of paused alerts. Renew at any time and click Reactivate all — every alert comes back on within seconds with no rebuild required.
What it doesn’t do, and when not to use it
Alerts trigger on Binance price only. FlowEntry-native sources — Sigma-fire alerts, whale-wall-near-price alerts, book-ratio-crosses alerts — are on the roadmap and not yet shipped. Same for chart screenshots in the Telegram body.
Trendline alerts currently support daily-close conditions only; 4-hour and weekly close variants aren’t wired yet. And trendline alerts must be created via the bell → Trendline place mode (we own the line). Lines you draw with TradingView’s native drawing tools aren’t tracked.
Don’t replicate Binance’s built-in alerts for the sake of it; use FlowEntry alerts when you want one place for the chart, the indicators, and the alert list. Don’t set a hundred alerts you’ll never act on — the cap is generous, but every fire is a tap on your attention. And don’t use Crossing on illiquid coins without a cooldown in Repeat mode; an illiquid book flickers all day.
Examples
Case A: zone-edge alert that caught a daily break
- Setup.
- Sigma gold zone on a coin at $X–$Y. User right-clicked $Y and set 1D Close Above.
- Signal.
- Daily candle closed just above $Y.
- Outcome.
- Telegram + fire-toast at the close; user was on the chart within minutes.
- Lesson.
- Daily-close alerts on zone edges are the lowest-effort, highest-signal use of the feature.
Case B: whale-wall ping
- Setup.
- A cyan whale wall sitting at $X under price. User set Below at slightly above $X as an early-warning band.
- Signal.
- Price approached the wall; alert fired before the wick touched.
- Outcome.
- User had time to open the chart and read the wall vs the live book.
- Lesson.
- Alerts pair naturally with Whale Walls — the wall tells you the level, the alert tells you the moment.
Case C: crossing-with-cooldown on a ranging coin
- Setup.
- Coin ranging tightly. User set Crossing in Repeat mode with a 30-minute cooldown.
- Signal.
- Price oscillated through the level six times in a day; alert fired four times (the cooldown swallowed two).
- Outcome.
- A steady drumbeat of "still ranging" without spam.
- Lesson.
- Repeat + cooldown is how you use Crossing on a noisy book without your phone dying.
Case D: subscription expiry + reactivate
- Setup.
- User’s 30-day pass expired with 22 active alerts.
- Signal.
- Banner appeared: "Subscription expired — 22 alerts paused."
- Outcome.
- User renewed, clicked Reactivate all, all 22 alerts came back on within seconds.
- Lesson.
- Alerts survive lapses. Renew and resume — no rebuild required.
Case E: diagonal support break, then re-anchor on the next leg
- Setup.
- User drew a trendline alert from a swing low six weeks back to a recent higher low. Condition: Trendline Crossing Down. The locked gold line sat under price; the math projected forward.
- Signal.
- A week later, price closed through the projected line on the daily; the fire-toast popped and Telegram pinged.
- Outcome.
- User opened the chart, marked the level the trendline broke at, then opened the (now triggered, orange) alert and clicked Re-anchor on chart. Two new clicks defined the next leg’s diagonal. The line came back gold, the condition and message persisted, the math re-projected.
- Lesson.
- A trendline alert plus the re-anchor flow gives you a single live alert for "this market’s slope just changed" — without having to delete and rebuild.