Coin Indicator
Whale Walls
Whale Walls turns the order book into two colours and a number, so you can see, at a glance, where the size is sitting and which side has the weight.
What it answers
- “Is there real demand sitting under price, or is the book empty?”
- “Is that resistance just a chart line, or is there actual size at that price?”
- “Did the wall hold, or did the whale pull it before the move?”
- “Which side of the book has more weight right now, bids or asks?”
- “Where in this zone did the smart money put their size?”
Mental model
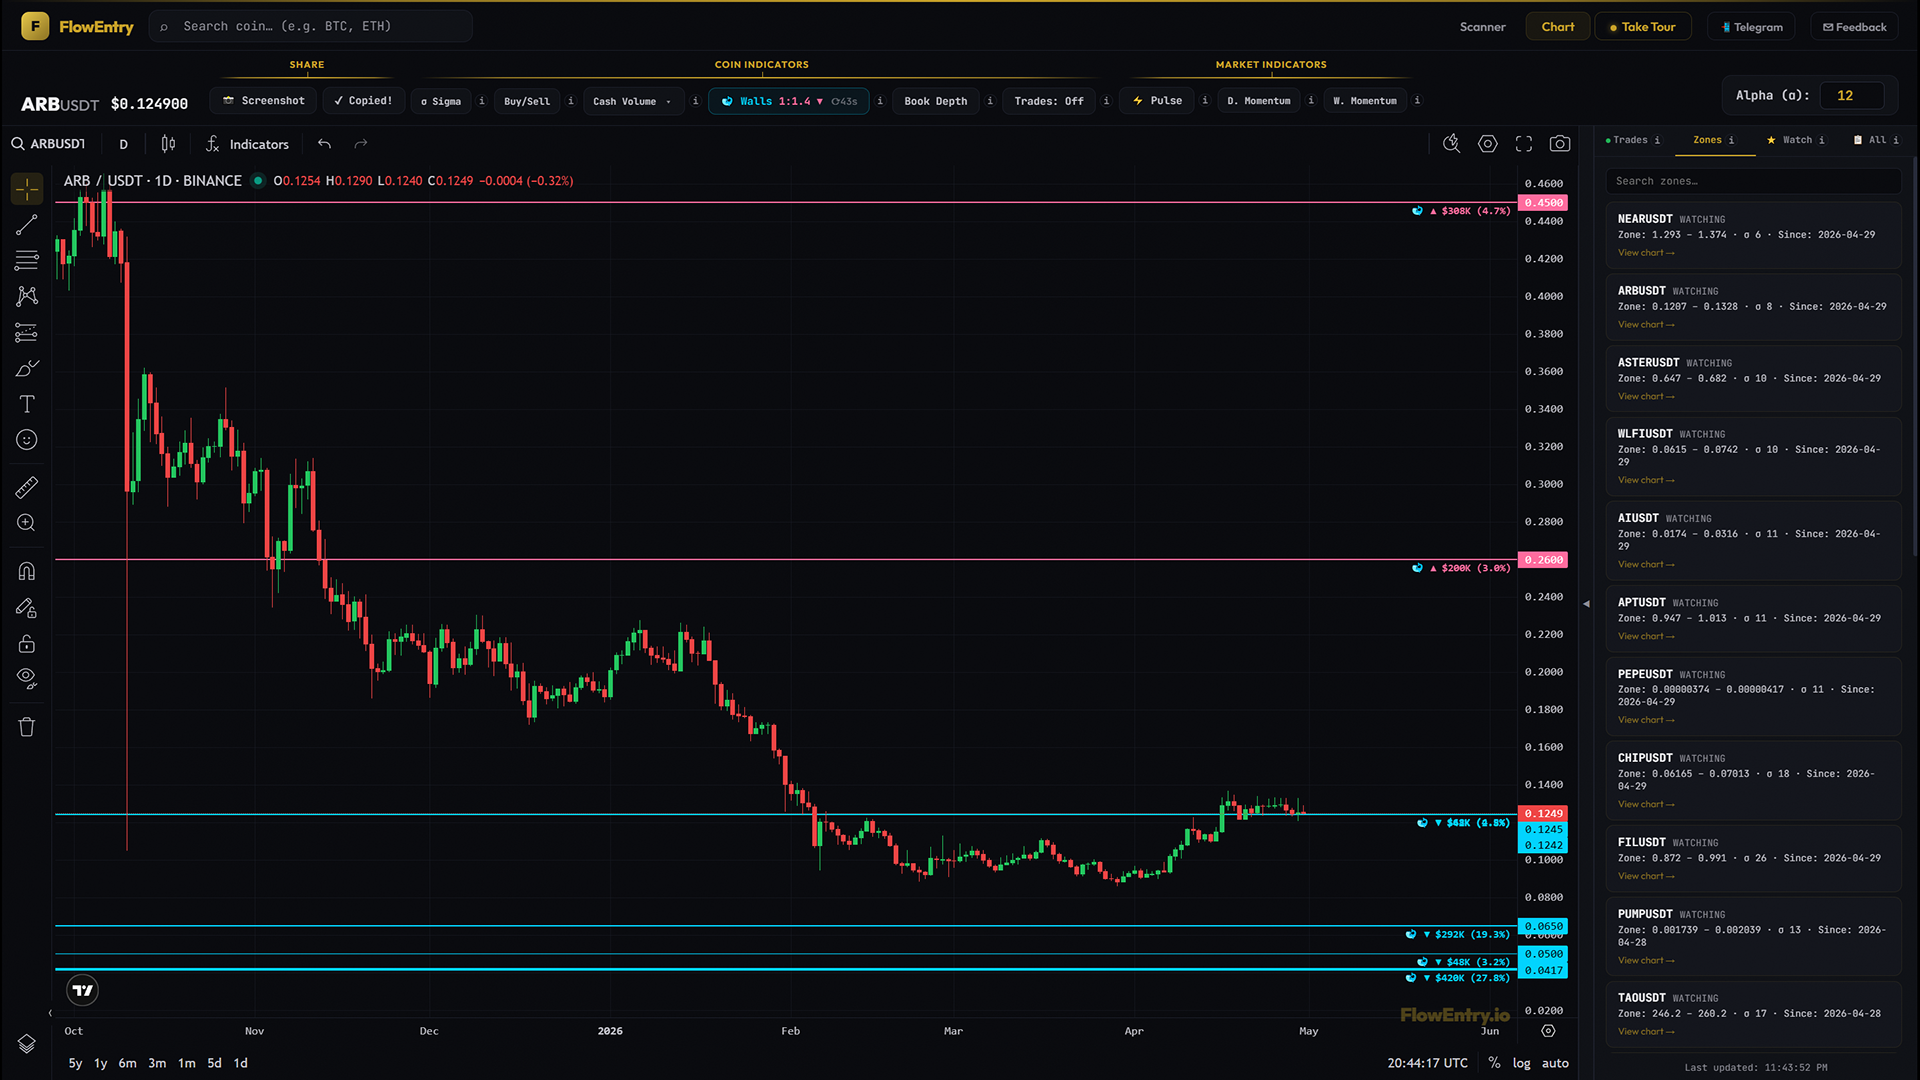
Whale Walls show you where the big resting orders are sitting in the book, right now, live. Cyan lines below price are real money parked on the buy side. Pink lines above price are real money parked on the sell side. Thicker line means bigger wall. Walls are not predictions, they are parked intent. Somebody put real size at this exact price, and they will either get filled there, get pushed through, or pull the order before either happens.
The imbalance pill on the toggle gives you a single read of which side has more weight in the book. The ghost lines (dashed) are walls that were just pulled. Somebody removed their bid or ask, often right before a move.
How to use it
- Confirm a level is realA horizontal you’ve drawn from price action is a guess. A cyan or pink line from Whale Walls at the same price is a confirmation that real money is sitting there.
- Rank the levelsMultiple walls on a chart get drawn at thicknesses proportional to USD size. The thickest line on the page is the most-funded level on this coin’s book. Trade around it accordingly.
- Read the book bias instantlyThe imbalance pill (1.4×, 0.7×, etc.) tells you the dollar weight of bid walls vs ask walls without you opening the book. Cyan-coloured number means the book leans bid; pink-coloured means it leans ask.
- Watch for pulled wallsA solid cyan line that turns into a dashed ghost cyan means somebody just removed their bid. If price was approaching it, that is somebody stepping out of the way of a drop. Ghosts age out over a few refresh cycles, so they only show recent removals.
- Triple Confluence with Sigma zonesHover any wall. If the tooltip says “✦ Triple Confluence”, that wall is inside a Sigma gold zone and the book is biased its way. Three independent signals agreeing on the same price. Treat that as the highest-conviction level on the chart.
- Trap WarningIf the tooltip says “⚠ Trap Warning”, there is a wall inside a zone but the book is biased the other way. The zone may fail. The size visible at the wall may be a magnet to draw price in, with the real flow positioned against it.
What it doesn’t do, and when not to use it
Walls do not tell you whether a wall will fill or get pulled. Resting orders are intent, not commitment. They do not tell you whether a wall is real or a spoof; the ghost-tracking helps, but the read takes practice. They do not show anything about historical price; this is a live order-book indicator, the lines are where size is now, not where size was last week.
Don’t use Whale Walls as a price target on its own. Combine with Sigma (was this price level active?) and Cash Volume (was real money trading at this level?). Avoid on low-liquidity coins where any single big order looks like a wall. And remember walls move; the 60-second refresh exists for a reason.
Why it works
The order book is the only honest part of the market structure. Charts can be drawn however a trader wants, but a $5M bid sitting at a price is $5M somebody is willing to commit at that exact level. The algorithm filters out normal-sized orders and surfaces only what is unusual on that specific coin’s book, so a “wall” on BTC and a “wall” on a small-cap are both calibrated to their own book’s average size. The cluster step prevents a single deep wall from being missed because the whale split it across adjacent ticks.
Examples
Case A: defended support
- Setup.
- A coin approaching a level with a thick cyan line.
- Signal.
- Wall holds across multiple 60s refreshes; price wicks into it and bounces.
- Outcome.
- Reversal off the level.
- Lesson.
- Solid wall plus held means real resting demand. The bounce was paid for.
Case B: pulled wall before a drop
- Setup.
- A coin consolidating with a thick cyan line below price.
- Signal.
- Cyan line turns into a dashed ghost on the next refresh; cyan imbalance flips toward pink.
- Outcome.
- Drop within minutes.
- Lesson.
- The whale stepped out of the way. Removed support is often more meaningful than visible support.
Case C: Triple Confluence entry
- Setup.
- A coin inside a downtrend, returning to a Sigma gold zone.
- Signal.
- Hovering a cyan line inside the zone shows “✦ Triple Confluence: Strong demand zone”.
- Outcome.
- Reversal off the zone.
- Lesson.
- Sigma (historical flow) plus wall (live size) plus book bias (cyan), all aligning at one price, is the highest-conviction level.
Case D: Trap Warning at zone
- Setup.
- A coin in an uptrend, returning to a Sigma gold zone from above.
- Signal.
- A pink wall sits inside the zone; tooltip shows “⚠ Trap Warning”.
- Outcome.
- Zone failed, price broke down.
- Lesson.
- A wall inside a zone biased the wrong way is a magnet for a stop hunt, not a defence of the zone.