Learn FlowEntry
Welcome to FlowEntry
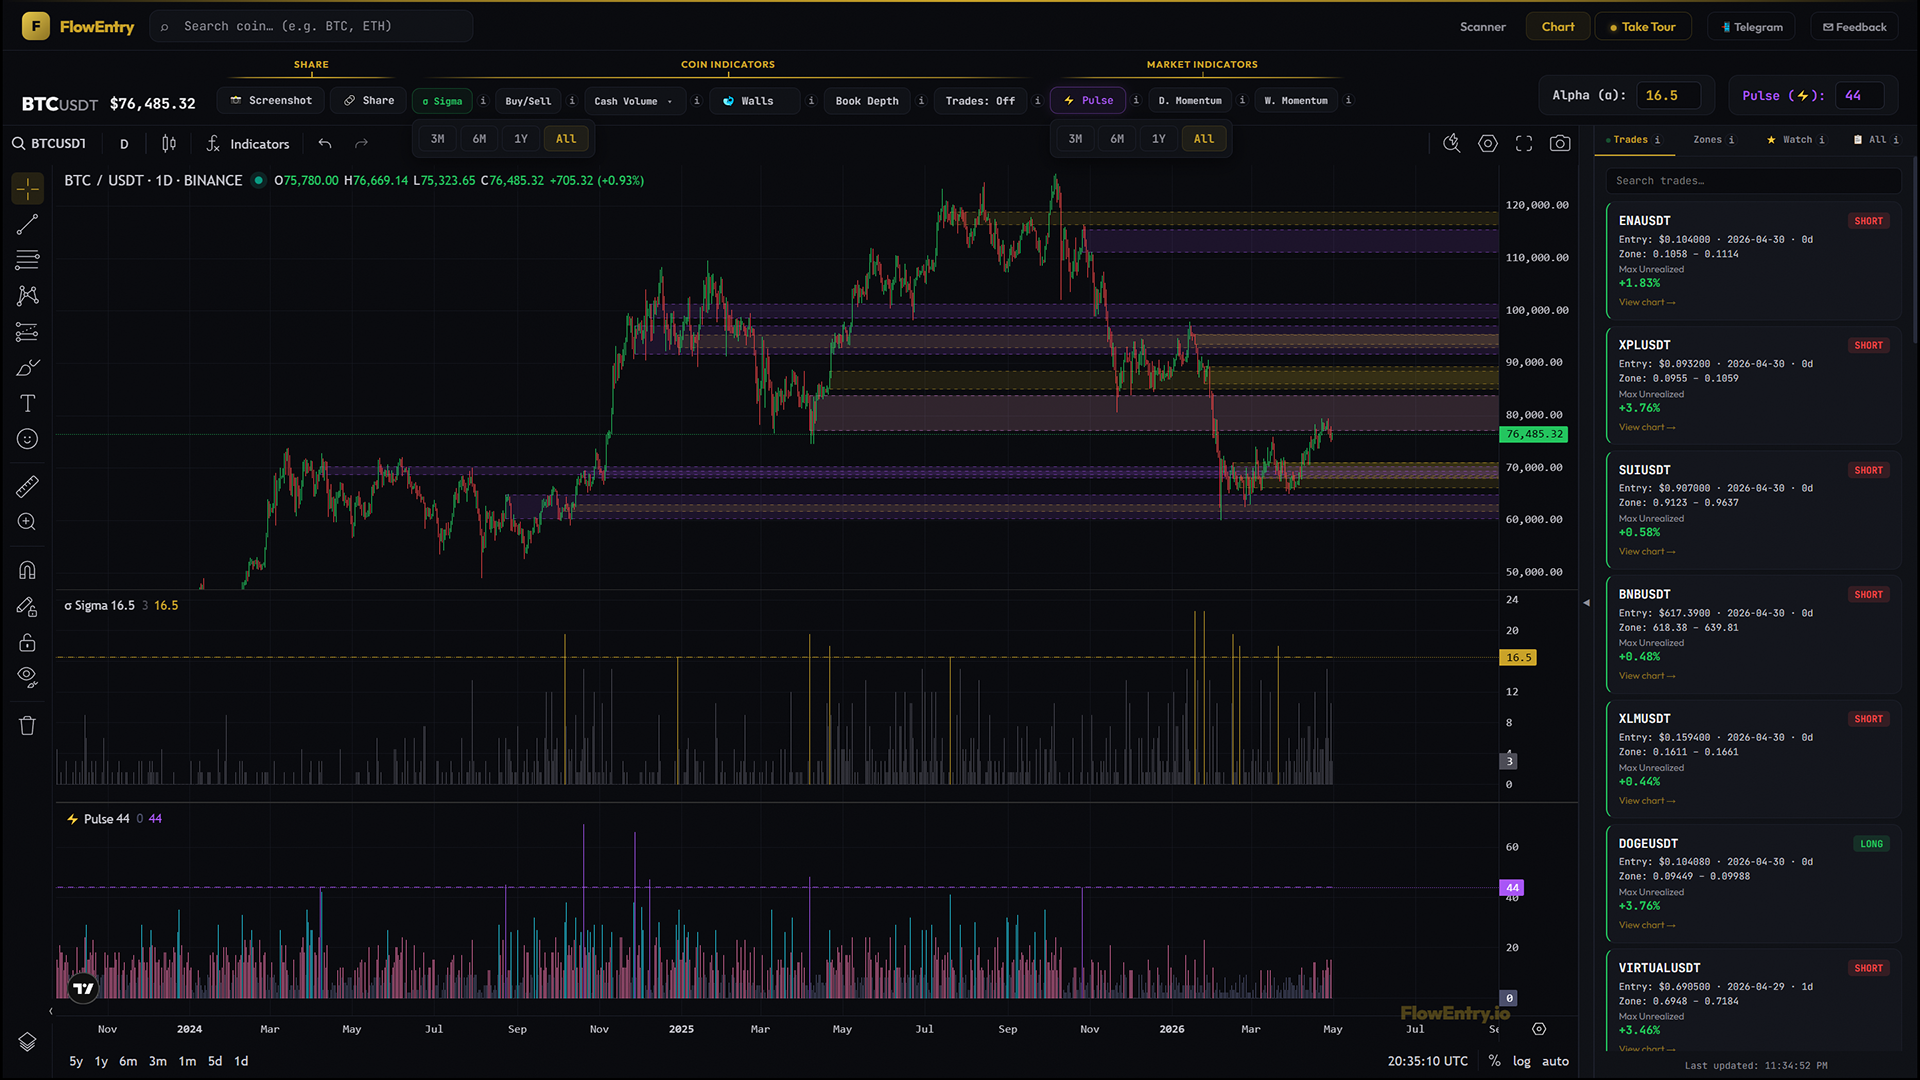
Everything you need to read the app. Start with the five-minute Quick Start below, then open any indicator in the sidebar for the deeper read. Every zone and signal FlowEntry draws sits on a live TradingView chart, so you can open the BTCUSD chart, add your own indicators, and read the flow against price yourself.
What FlowEntry is
FlowEntry watches every USDT pair on Binance for unusual one-sided trade flow. The kind of flow that happens when bigger players move real volume. When a coin lights up, it shows up on the Scanner. When you open the chart, the indicators tell you the count, the direction, the dollar weight, and what the rest of the market is doing at the same time.
You don’t need to know every indicator on day one. The five-minute routine below is enough to start.
Quick Start
Your first five minutes in the app.
- 1
Open the chart
The default landing is BTC/USDT. Toggle Pulse, D. Momentum, and W. Momentum from the top bar. Three market-wide reads that summarise the broader market in three histogram panes.
- 2
Read the colours
Strong colours across the three panes mean the market is moving in one direction. Mixed or muted colours mean the day is quiet and you should expect fewer setups.
- 3
Switch to the Scanner
Tiles with a ✦ are coins where flow fired today. A B:NN% badge means the order book is bid-stacked (bullish bias); A:NN% means ask-stacked (bearish). ✦ + matching book badge is a dual-signal tile worth opening.
- 4
Pick one and confirm
Click the tile. On the chart, toggle Sigma, Buy/Sell, and Cash Volume. If the count, the direction, and the dollar weight all agree, the setup is flow-backed.
- 5
Read the bot
Open the Trades tab in the right sidebar to see what the bot is currently in. Open the Zones tab to see what is queued up for tomorrow.
Where to go next
Pick any indicator from the sidebar. Sigma is the headline indicator and a good first read.